\$\begingroup\$
\$\endgroup\$
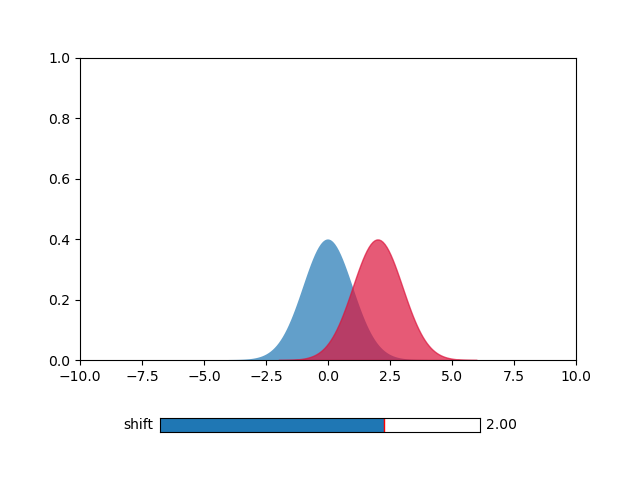
There is few points In the script I don't like I think it can be improved, but I need a second opinion, here is the interactive plot I'm trying to build.
here is the code with thought in comments.
#!/usr/bin/python3
from functools import lru_cache
import numpy as np
import scipy.stats as ss
import matplotlib.pyplot as plt
import matplotlib.widgets as widgets
@lru_cache # beacuse it redraws each time
def get_pdf(mu, sigma=1, offset=4):
 o = sigma * offset
 x = np.linspace(mu - o, mu + o, 100)
 rv = ss.norm(mu, sigma)
 return x, rv.pdf(x)
fig, ax = plt.subplots()
# added the subplot for bottom margin and the slider, since its also the ax
plt.subplots_adjust(bottom=0.25)
ax.fill_between(*get_pdf(0), label='A', alpha=0.7)
ax.set_xlim(-10, 10)
ax.set_ylim(0, 1)
# my guess is this has to be integrated with the update rather than outside
# and using t variable as global which I don't like, and guess it can be improved
t = ax.fill_between(*get_pdf(2), label='B', color='crimson', alpha=0.7)
slider = widgets.Slider(
 # ax position are absolute, should be easy without subplot may be
 ax = plt.axes([0.25, 0.1, 0.5, 0.03]),
 label = "shift",
 valmin = -5,
 valmax = 5,
 valinit = 2,
 valstep = 0.5
)
def update(val):
 x, y = get_pdf(val)
 global t # really hate to do this
 t.remove()
 t = ax.fill_between(*get_pdf(val), color='crimson', alpha=0.7)
 fig.canvas.draw_idle()
slider.on_changed(update)
ax.legend()
plt.show()
1 Answer 1
\$\begingroup\$
\$\endgroup\$
9
If you want to get rid of the global t you could consider creating a class to manage the data and updating. I quickly whipped something together, although I'm not well versed enough in stats to have a good idea about what names would be more appropriate.
from functools import lru_cache
import numpy as np
import scipy.stats as ss
import matplotlib.pyplot as plt
import matplotlib.widgets as widgets
#probability density function generator: chached
@lru_cache # beacuse it redraws each time
def get_pdf(mu, sigma=1, offset=4):
 o = sigma * offset
 x = np.linspace(mu - o, mu + o, 100)
 rv = ss.norm(mu, sigma)
 return x, rv.pdf(x)
# This simple class will hold the reference to `t` so that it doesn't need to
# be a global
class Data():
 '''
 A simple class that plots data on an axis and contains a method for updating
 the plot.
 '''
 def __init__(self, ax, **properties):
 self.properties = properties
 self.t = ax.fill_between(*get_pdf(2), **properties)
 def update(self, val):
 x, y = get_pdf(val)
 self.t.remove()
 self.t = ax.fill_between(x, y, **self.properties)
 fig.canvas.draw_idle()
# Generate the figure and axis for our widget
fig, ax = plt.subplots()
# added the subplot for bottom margin and the slider, since its also the ax
plt.subplots_adjust(bottom=0.25)
# add a slider widget
slider = widgets.Slider(
 # ax position are absolute, should be easy without subplot may be
 ax = plt.axes([0.25, 0.1, 0.5, 0.03]),
 label = "shift",
 valmin = -5,
 valmax = 5,
 valinit = 2,
 valstep = 0.5
)
# add a reference distribution *A*
ax.fill_between(*get_pdf(0), label='A', alpha=0.7)
ax.set_xlim(-10, 10)
ax.set_ylim(0, 1)
# Create a data instance
properties = dict(label='B', color='crimson', alpha=0.7)
data = Data(ax=ax, **properties)
# link data update method to slider.on_changed
slider.on_changed(data.update)
ax.legend()
plt.show()
```
answered May 28, 2020 at 9:01
-
\$\begingroup\$ You are not using the
x, yyou defined in theupdatemethod. You can either remove them or re-use them in thefill_between. \$\endgroup\$Graipher– Graipher2020年05月28日 10:27:30 +00:00Commented May 28, 2020 at 10:27 -
\$\begingroup\$ Ah, just saw that the same is true in the OP :) \$\endgroup\$Graipher– Graipher2020年05月28日 10:28:02 +00:00Commented May 28, 2020 at 10:28
-
\$\begingroup\$ Thanks, want to edit the post perhaps? \$\endgroup\$Andrew Micallef– Andrew Micallef2020年05月28日 10:29:36 +00:00Commented May 28, 2020 at 10:29
-
\$\begingroup\$ No, that would be a valid point to include in a review! Feel free to edit your post to include it, though. \$\endgroup\$Graipher– Graipher2020年05月28日 10:30:19 +00:00Commented May 28, 2020 at 10:30
-
1\$\begingroup\$ actually, on reflection I feel like getting
x,y = get_pdf(val)and thenax.fill_between(x,y...)is more pythonic than*get_pdf(val)\$\endgroup\$Andrew Micallef– Andrew Micallef2020年05月28日 11:08:10 +00:00Commented May 28, 2020 at 11:08
lang-py