A First Course in Probability (10th Edition)
A First Course in Probability (10th Edition)
10th Edition
ISBN: 9780134753119
Author: Sheldon Ross
Publisher: PEARSON
expand_more
expand_more
format_list_bulleted
Bartleby Related Questions Icon
Related questions
Question
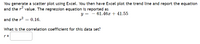
Transcribed Image Text:You generate a scatter plot using Excel. You then have Excel plot the trend line and report the equation
and the r2 value. The regression equation is reported as
y = - 61.46x + 41.55
and the r? = 0.16.
What is the correlation coefficient for this data set?
r =
Expert Solution
Check MarkThis question has been solved!
Explore an expertly crafted, step-by-step solution for a thorough understanding of key concepts.
bartleby
Step by stepSolved in 2 steps
Knowledge Booster
Background pattern image
Similar questions
- You generate a scatter plot using Excel. You then have Excel plot the trend line and report the equation and ther value. The regression equation is reported as y = 59.31x + 26.22 and the r2 0.1296. What is the correlation coefficient for this data set? r = Submit Question M -> & 3. 4. 8. CO 6 %24 %23arrow_forwardUsing your favorite statistics software package, you generate a scatter plot with a regression equation and correlation coefficient. The regression equation is reported as -36.51x+76.99 and r = -0.437. What proportion of the variation in y can be explained by the linear regression equation found above? % Report answer as a percentage accurate to one decimal place. Submit Questionarrow_forwardYou generate a scatter plot using Excel. You then have Excel plot the trend line and report the equation and the r2r2 value. The regression equation is reported asy=−38.54x+27.71y=-38.54x+27.71and the r2=0.36r2=0.36.What is the correlation coefficient for this data set?r =arrow_forward
- Using your favorite statistics software package, you generate a scatter plot with a regression equation and correlation coefficient. The regression equation is reported as y = – 17.88x + 41.39 and the r = - 0.405. What proportion of the variation in y can be explained by the variation in the values of x? r2 = Report answer as a percentage accurate to one decimal place.arrow_forwardThe data show the chest size and weight of several bears. Find the regression equation, letting chest size be the independent (x) variable. Then find the best predicted weight of a bear with a chest size of 58 inches. Is the result close to the actual weight of 572 pounds? Use a significance level of 0.05. Chest size (inches) 46 57 53 41 40 40 Weight (pounds) 384 580 542 358 306 320 LOADING... Click the icon to view the critical values of the Pearson correlation coefficient r. What is the regression equation? y=nothing+nothingx (Round to one decimal place as needed.)arrow_forwardUsing your favorite statistics software package, you generate a scatter plot with a regression equ correlation coefficient. The regression equation is reported as y = -11.24x +34.27 and the r = -0.47. What proportion of the variation in y can be explained by the variation in the values of x? r2 = % Report answer as a percentage accurate to one decimal place. Submit Questionarrow_forward
- Using your favorite statistics software package, you generate a scatter plot with a regression equation and correlation coefficient. The regression equation is reported as 90.18x + 67.52 and the r = -0.345. What proportion of the variation in y can be explained by the variation in the values of x? s2 = Report answer as a percentage accurate to one decimal place.arrow_forwardYou generate a scatter plot using Excel. You then have Excel plot the trend line and report the equation and the r value. The regression equation is reported as y = – 17.55x + 59.45 and the r? = 0.0081. What is the correlation coefficient for this data set? r =arrow_forwardUsing your favorite statistics software package, you generate a scatter plot with a regression equation and correlation coefficient. The regression equation is reported as y = - 97.06x + 49.41 and the r = - 0.77. What percentage of the variation in y can be explained by the variation in the values of x? % (Report exact answer, and do not enter the % sign)arrow_forward
- Please explain simply. Thanks.arrow_forwardUsing your favorite statistics software package, you generate a scatter plot with a regression equation and correlation coefficient. The regression equation is reported as y = 30.42x + 81.82 and the r = 0.9. What percentage of the variation in y can be explained by the variation in the values of x? r2 = % (Report exact answer, and do not enter the % sign)arrow_forwardUsing your favorite statistics software package, you generate a scatter plot with a regression equation and correlation coefficient. The regression equation is reported asy=−36.16x+83.35y=-36.16x+83.35and the r=−0.945r=-0.945.What proportion of the variation in y can be explained by the variation in the values of x?r2 = %Report answer as a percentage accurate to one decimal place.arrow_forward
arrow_back_ios
SEE MORE QUESTIONS
arrow_forward_ios
Recommended textbooks for you
- Text book imageA First Course in Probability (10th Edition)ProbabilityISBN:9780134753119Author:Sheldon RossPublisher:PEARSONText book image
Text book image
A First Course in Probability (10th Edition)
Probability
ISBN:9780134753119
Author:Sheldon Ross
Publisher:PEARSON
Text book image