MATLAB: An Introduction with Applications
MATLAB: An Introduction with Applications
6th Edition
ISBN: 9781119256830
Author: Amos Gilat
Publisher: John Wiley & Sons Inc
expand_more
expand_more
format_list_bulleted
Bartleby Related Questions Icon
Related questions
Question
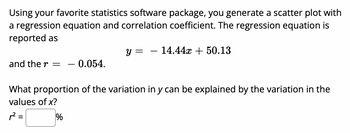
Transcribed Image Text:Using your favorite statistics software package, you generate a scatter plot with
a regression equation and correlation coefficient. The regression equation is
reported as
y = - 14.44x + 50.13
and the r = - 0.054.
What proportion of the variation in y can be explained by the variation in the
values of x?
R2=
%
Expert Solution
Check MarkThis question has been solved!
Explore an expertly crafted, step-by-step solution for a thorough understanding of key concepts.
bartleby
Step by stepSolved in 2 steps
Knowledge Booster
Background pattern image
Similar questions
- Using your favorite statistics software package, you generate a scatter plot with a regression equation and correlation coefficient. The regression equation is reported as y = - 10.15z + 80.06 and the r = - 0.218. What proportion of the variation in y can be explained by the variation in the values of x? r2 = Report answer as a percentage accurate to one decimal place.arrow_forwardUsing your favorite statistics software package, you generate a scatter plot with a regression equation and correlation coefficient. The regression equation is reported asy=−22.11x+95.89y=-22.11x+95.89and the r=−0.602r=-0.602.What proportion of the variation in y can be explained by the variation in the values of x?r2 = Report answer as a percentage accurate to one decimal place.arrow_forwardUsing your favorite statistics software package, you generate a scatter plot with a regression equation and correlation coefficient. The regression equation is reported as y=84.14x+87.07 and the r=0.94 What percentage of the variation in y can be explained by the variation in the values of x?arrow_forward
- A regression was run to determine if there is a relationship between hours of TV watched per day, xx, and number of sit-ups, yy, a person can do in a minute.The results of the regression were: y=ax+b a=-1.105 b=27.483Use this to predict the number of sit-ups a person who watches 9.59.5 hours of TV can do in a minute. Round to the nearest whole number.arrow_forwardUsing your favorite statistics software package, you generate a scatter plot with a regression equation and correlation coefficient. The regression equation is reported as y=−18.81x+12.98 and the r=−0.933.What proportion of the variation in y can be explained by the variation in the values of x? r2 = %Report answer as a percentage accurate to one decimal place.arrow_forwardUsing your favorite statistics software package, you generate a scatter plot with a regression equation and correlation coefficient. The regression equation is reported asy=−94.15x+39.69y=-94.15x+39.69and the r=−0.12r=-0.12.What percentage of the variation in y can be explained by the variation in the values of x?r2 = % (Report exact answer, and do not enter the % sign)arrow_forward
- Using your favorite statistics software package, you generate a scatter plot with a regression equation and correlation coefficient. The regression equation is reported as y=55.54x+24.01 and the r=0.11.What percentage of the variation in y can be explained by the variation in the values of x? r2 = % (Report exact answer, and do not enter the % sign)arrow_forwardYou generate a scatter plot using Excel. You then have Excel plot the trend line and report the equation and the r value. The regression equation is reported as 2. y = – 69.87 + 54.78 and the r 0.3721. What is the correlation coefficient for this data set? r =arrow_forwardUsing your favorite statistics software package, you generate a scatter plot with a regression equation and correlation coefficient. The regression equation is reported as and the r = -0.4. y=-60.93x + 87.44 What percentage of the variation in y can be explained by the variation in the values of x? r2 = % (Report exact answer, and do not enter the % sign)arrow_forward
- Using your favorite statistics software package, you generate a scatter plot with a regression equation and correlation coefficient. The regression equation is reported as ŷ = 97.51x + 82.81 and r = 0.802. What proportion of the variation in y can be explained by the linear regression equation found above? % Report answer as a percentage accurate to one decimal place.arrow_forwardYou generate a scatter plot using Excel. You then have Excel plot the trend line and report the equation and the p2 value. The regression equation is reported as 27.84 + - 74.89x and the r2 = 0.2209. What is the correlation coefficient for this data set? r =arrow_forwardUsing your favorite statistics software package, you generate a scatter plot with a regression equation and correlation coefficient. The regression equation is reported as y = 42.52x + 86.52 and the r = 0.67. What percentage of the variation in y can be explained by the variation in the values of x? pi = % (Report exact answer, and do not enter the % sign)arrow_forward
arrow_back_ios
SEE MORE QUESTIONS
arrow_forward_ios
Recommended textbooks for you
- Text book imageMATLAB: An Introduction with ApplicationsStatisticsISBN:9781119256830Author:Amos GilatPublisher:John Wiley & Sons IncText book imageProbability and Statistics for Engineering and th...StatisticsISBN:9781305251809Author:Jay L. DevorePublisher:Cengage LearningText book imageStatistics for The Behavioral Sciences (MindTap C...StatisticsISBN:9781305504912Author:Frederick J Gravetter, Larry B. WallnauPublisher:Cengage Learning
- Text book imageElementary Statistics: Picturing the World (7th E...StatisticsISBN:9780134683416Author:Ron Larson, Betsy FarberPublisher:PEARSONText book imageThe Basic Practice of StatisticsStatisticsISBN:9781319042578Author:David S. Moore, William I. Notz, Michael A. FlignerPublisher:W. H. FreemanText book imageIntroduction to the Practice of StatisticsStatisticsISBN:9781319013387Author:David S. Moore, George P. McCabe, Bruce A. CraigPublisher:W. H. Freeman
Text book image
MATLAB: An Introduction with Applications
Statistics
ISBN:9781119256830
Author:Amos Gilat
Publisher:John Wiley & Sons Inc
Text book image
Probability and Statistics for Engineering and th...
Statistics
ISBN:9781305251809
Author:Jay L. Devore
Publisher:Cengage Learning
Text book image
Statistics for The Behavioral Sciences (MindTap C...
Statistics
ISBN:9781305504912
Author:Frederick J Gravetter, Larry B. Wallnau
Publisher:Cengage Learning
Text book image
Elementary Statistics: Picturing the World (7th E...
Statistics
ISBN:9780134683416
Author:Ron Larson, Betsy Farber
Publisher:PEARSON
Text book image
The Basic Practice of Statistics
Statistics
ISBN:9781319042578
Author:David S. Moore, William I. Notz, Michael A. Fligner
Publisher:W. H. Freeman
Text book image
Introduction to the Practice of Statistics
Statistics
ISBN:9781319013387
Author:David S. Moore, George P. McCabe, Bruce A. Craig
Publisher:W. H. Freeman