MATLAB: An Introduction with Applications
MATLAB: An Introduction with Applications
6th Edition
ISBN: 9781119256830
Author: Amos Gilat
Publisher: John Wiley & Sons Inc
expand_more
expand_more
format_list_bulleted
Bartleby Related Questions Icon
Related questions
bartleby
Concept explainers
Question
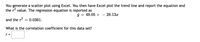
Transcribed Image Text:You generate a scatter plot using Excel. You then have Excel plot the trend line and report the equation and
the r value. The regression equation is reported as
49.05 +
28.13x
and the r?
= 0.0361.
What is the correlation coefficient for this data set?
r =
Expert Solution
Check MarkThis question has been solved!
Explore an expertly crafted, step-by-step solution for a thorough understanding of key concepts.
bartleby
This is a popular solution
bartleby
Trending nowThis is a popular solution!
bartleby
Step by stepSolved in 2 steps with 1 images
Knowledge Booster
Background pattern image
Learn more about
Need a deep-dive on the concept behind this application? Look no further. Learn more about this topic, statistics and related others by exploring similar questions and additional content below.Similar questions
- You generate a scatter plot using Excel. You then have Excel plot the trend line and report the equation and the p2 value. The regression equation is reported as 27.84 + - 74.89x and the r2 = 0.2209. What is the correlation coefficient for this data set? r =arrow_forwardUsing your favorite statistics software package, you generate a scatter plot with a regression equation and correlation coefficient. The regression equation is reported as 91.01x + 56.25 and r = 0.544. What proportion of the variation in y can be explained by the linear regression equation found above? % Report answer as a percentage accurate to one decimal place.arrow_forwardUsing your favorite statistics software package, you generate a scatter plot with a regression equation and correlation coefficient. The regression equation is reported as Y = 71.95x + 52.94 and the r = - 0.148. - What proportion of the variation in y can be explained by the variation in the values of x? r2 =arrow_forward
- Using your favorite statistics software package, you generate a scatter plot with a regression equation and correlation coefficient. The regression equation is reported as y = 98.52x + 27.93 and the r = 0.247. What proportion of the variation in y can be explained by the variation in the values of x? r? = % Report answer as a percentage accurate to one decimal place.arrow_forwardUsing your favorite statistics software package, you generate a scatter plot with a regression equation and correlation coefficient. The regression equation is reported asy=29.62x+64.57y=29.62x+64.57and the r=0.784r=0.784.What proportion of the variation in y can be explained by the variation in the values of x? r2 = %Report answer as a percentage accurate to one decimal place.arrow_forwardI need the right answer to this problem.arrow_forward
- Using your favorite statistics software package, you generate a scatter plot with a regression equation and correlation coefficient. The regression equation is reported as y=-59.97x+67.54 and the r=-0.31 What percentage of the variation in y can be explained by the variation in the values of x? r2 = % (Report exact answer, and do not enter the % sign) .arrow_forwardYou generate a scatter plot using Excel. You then have Excel plot the trend line and report the equation and the r2 value. The regression equation is reported as y = - 61.46x + 41.55 and the r? = 0.16. What is the correlation coefficient for this data set? r =arrow_forwardUsing your favorite statistics software package, you generate a scatter plot with a regression equation and correlation coefficient. The regression equation is reported as -36.51x+76.99 and r = -0.437. What proportion of the variation in y can be explained by the linear regression equation found above? % Report answer as a percentage accurate to one decimal place. Submit Questionarrow_forward
- You generate a scatter plot using Excel. You then have Excel plot the trend line and report the equation and the r2r2 value. The regression equation is reported asy=−38.54x+27.71y=-38.54x+27.71and the r2=0.36r2=0.36.What is the correlation coefficient for this data set?r =arrow_forwardUsing your favorite statistics software package, you generate a scatter plot with a regression equation and correlation coefficient. The regression equation is reported as y = – 17.88x + 41.39 and the r = - 0.405. What proportion of the variation in y can be explained by the variation in the values of x? r2 = Report answer as a percentage accurate to one decimal place.arrow_forwardUse the time/tip data from the table below, which includes data from New York City taxi rides. (The distances are in miles, the times are in minutes, the fares are in dollars, and the tips are in dollars.) Find the regression equation, letting time be the predictor (x) variable. Find the best predicted tip for a ride that takes 30 minutes. How does the result compare to the actual tip amount of 4ドル.70? Use a significance level of 0.05. Distance 1.80 12.71 1.32 Time 1.65 8.51 1.40 1.02 2.47 Fare Tip 25.00 27.00 8.00 16.30 36.80 7.80 9.80 31.75 12.30 1.50 0.00 0.00 1.96 2.98 2.46 11.00 31.00 18.00 8.00 18.00 7.80 14.30 2.34 4.29 The regression equation is ŷ =+ (x. (Round the y-intercept to two decimal places as needed. Round the slope to four decimal places as needed.)arrow_forward
arrow_back_ios
SEE MORE QUESTIONS
arrow_forward_ios
Recommended textbooks for you
- Text book imageMATLAB: An Introduction with ApplicationsStatisticsISBN:9781119256830Author:Amos GilatPublisher:John Wiley & Sons IncText book imageProbability and Statistics for Engineering and th...StatisticsISBN:9781305251809Author:Jay L. DevorePublisher:Cengage LearningText book imageStatistics for The Behavioral Sciences (MindTap C...StatisticsISBN:9781305504912Author:Frederick J Gravetter, Larry B. WallnauPublisher:Cengage Learning
- Text book imageElementary Statistics: Picturing the World (7th E...StatisticsISBN:9780134683416Author:Ron Larson, Betsy FarberPublisher:PEARSONText book imageThe Basic Practice of StatisticsStatisticsISBN:9781319042578Author:David S. Moore, William I. Notz, Michael A. FlignerPublisher:W. H. FreemanText book imageIntroduction to the Practice of StatisticsStatisticsISBN:9781319013387Author:David S. Moore, George P. McCabe, Bruce A. CraigPublisher:W. H. Freeman
Text book image
MATLAB: An Introduction with Applications
Statistics
ISBN:9781119256830
Author:Amos Gilat
Publisher:John Wiley & Sons Inc
Text book image
Probability and Statistics for Engineering and th...
Statistics
ISBN:9781305251809
Author:Jay L. Devore
Publisher:Cengage Learning
Text book image
Statistics for The Behavioral Sciences (MindTap C...
Statistics
ISBN:9781305504912
Author:Frederick J Gravetter, Larry B. Wallnau
Publisher:Cengage Learning
Text book image
Elementary Statistics: Picturing the World (7th E...
Statistics
ISBN:9780134683416
Author:Ron Larson, Betsy Farber
Publisher:PEARSON
Text book image
The Basic Practice of Statistics
Statistics
ISBN:9781319042578
Author:David S. Moore, William I. Notz, Michael A. Fligner
Publisher:W. H. Freeman
Text book image
Introduction to the Practice of Statistics
Statistics
ISBN:9781319013387
Author:David S. Moore, George P. McCabe, Bruce A. Craig
Publisher:W. H. Freeman