MATLAB: An Introduction with Applications
MATLAB: An Introduction with Applications
6th Edition
ISBN: 9781119256830
Author: Amos Gilat
Publisher: John Wiley & Sons Inc
expand_more
expand_more
format_list_bulleted
Bartleby Related Questions Icon
Related questions
bartleby
Concept explainers
Question
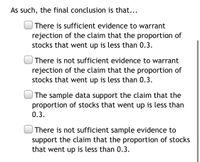
Transcribed Image Text:As such, the final conclusion is that...
| There is sufficient evidence to warrant
rejection of the claim that the proportion of
stocks that went up is less than 0.3.
There is not sufficient evidence to warrant
rejection of the claim that the proportion of
stocks that went up is less than 0.3.
The sample data support the claim that the
proportion of stocks that went up is less than
0.3.
There is not sufficient sample evidence to
support the claim that the proportion of stocks
that went up is less than 0.3.
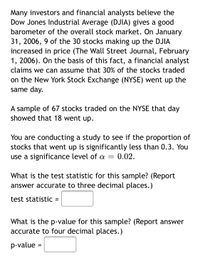
Transcribed Image Text:Many investors and financial analysts believe the
Dow Jones Industrial Average (DJIA) gives a good
barometer of the overall stock market. On January
31, 2006, 9 of the 30 stocks making up the DJIA
increased in price (The Wall Street Journal, February
1, 2006). On the basis of this fact, a financial analyst
claims we can assume that 30% of the stocks traded
on the New York Stock Exchange (NYSE) went up the
same day.
A sample of 67 stocks traded on the NYSE that day
showed that 18 went up.
You are conducting a study to see if the proportion of
stocks that went up is significantly less than 0.3. You
use a significance level of a = 0.02.
What is the test statistic for this sample? (Report
answer accurate to three decimal places.)
test statistic =
What is the p-value for this sample? (Report answer
accurate to four decimal places.)
p-value =
Expert Solution
Check MarkThis question has been solved!
Explore an expertly crafted, step-by-step solution for a thorough understanding of key concepts.
bartleby
This is a popular solution
bartleby
Trending nowThis is a popular solution!
bartleby
Step by stepSolved in 3 steps with 1 images
Knowledge Booster
Background pattern image
Learn more about
Need a deep-dive on the concept behind this application? Look no further. Learn more about this topic, statistics and related others by exploring similar questions and additional content below.Similar questions
- For F(2,54) = 6.10, p <.01 was the result statistically signifigantarrow_forward2b. It is thought that 20% of Annual Tax returns to the Australian Tax Office (ATO) contain errors of one kind or another. An auditor in the ATO investigating the number of returns with errors in a particular industry takes a sample of 25 returns and classifies each return as being "in error" or "not in error". i. If the variable X is used to represent the number of returns in the sample that are in error, and assuming this industry is no different to other industries in terms of the error rate, then state:• the values that X may take;• the distribution of this variable; and • the parameter/s of this distribution. ii. Determine the probability that 6 or less returns in this sample are in error. The auditor found that there were 13 tax returns with errors in this sample. iii. Determine the probability of finding 13 or more returns with errors if indeed the error rate was 20%. iv. Based upon your answer for part iii., what conclusion might the auditor make about this particular industry...arrow_forwardState the final conclusion that addresses the original claim. (Reject/Fail) to Reject H0. There is (sufficient/not sufficient) evidence to conclude that the original claim that the mean of the population of student course evaluations is equal to 4.25 (is/is not) correct.arrow_forward
- Members of the city council want to know if a majority of city residents supports a 1% increase in the sales tax to fund road repairs. To investigate, they survey a random sample of 300 city residents and use the results to test the following hypotheses: Ho p = 0.50 H p> 0.50 where p is the proportion of all city residents who support a 1% increase in the sales tax to fund road repairs. Given that P-value = 0.18, which of the following would be the most appropriate conclusion? Because the P-value is large, we reject Ho. We have convincing evidence that at most 50% of city residents support the tax increase. Because the P-value is large, we fail to reject Ho. We have convincing evidence that more than 50% of cit residents support the tax increase, Because the P-value is large, we reject Ho. We have convincing evidence that more than 50% of city residents support the tax increase. O Because the P-value is large, we fail to reject Họ. We do not have convincing evidence that more than 50%...arrow_forwardIs there a relationship between test scores of persons who have gone through a certain job training program and their subsequent performance on the job. Poor Fair Good Total Below avg. 67 64 25 156 Average 42 76 56 174 Above 10 23 37 70 Totals 119 163 118 400 State the conclusion.arrow_forwardIndicate whether the following statements are true, false, or uncertain, and provide a short (no more than three sentences) justification of your response. 1. Consider a setting where two researchers are trying to estimate the relation between a specific variable of interest x and an outcome variable y. While the first researcher (we shall call her A) has been very careful in the measurement of y, the second one (researcher B) has had problems with data entry, which resulted in the outcome being observed with a substantial amount of measurement error. As long as the measurement error is independent of x, we expect the range of estimates the two researchers will get to be the same.arrow_forward
- 5. Seventy percent of clay pots are produced by Machine 1 and 30% by Machine 2. Among all pots produced by Machine 1, 4% are defective, and of those produced by Machine 2, 8% are defective. a) What percentage of the total produced are defective? (0.70)(0.04) + (0.30)(0.08) = 0.052 or 5.2% b) If a pot is found to be defective, what is the probability that it was produced by Machine 2? Explain your answer. (0.30)(0.08) 0.052 = 0.4615 or 46.2%arrow_forwardA research center claims that at least 27% of adults in a certain country think that their taxes will be audited. In a random sample of 1200 adults in that country in a recent year, 23% say they are concerned that their taxes wilI be audited. At a=0.10, is there enough evidence to reject the center's claim? Complete parts (a) through (e) below. 東 票 O D. The percentage of adults in the country who think that their taxes will be audited is not %. Let p be the population proportion of successes, where a success is an adult in the country who thinks that their taxes will be audited. State H, and H,. Select the correct choice below and fill in the answer boxes to complete your choice. (Round to two decimal places as needed.) Courses rse Home O A. Ho PS OB. Ho P gnments Ha p> Ha p2 Ha ps CD. Ho p2 0.27 OE Ho P- OF Ho Pt debook H p< 0.27 H, pt H3 p= pter Contents (b) Find the critical value(s) and identify the rejection region(s). Identify the critical value(s) for this test. imedia Library...arrow_forwardA hospital director is told that 55% of the treated patients are insured. The director wants to test the claim that the percentage of insured patients is less than the expected percentage. A sample of 310 patients found that 155 were insured. At the 0.02 level, is there enough evidence to support the director's claim? Answer There is sufficient evidence to support the claim that the percentage of insured patients is less than 55 % . ○しろまる There is not sufficient evidence to support the claim that the percentage of insured patients is less than 55 %. Tables Keypad Keyboard Shortcutsarrow_forward
- The Admission director for a college far from mart and town believes that an inverse relationship exists between a private college's average discount rate(determined by the average amount of scholarships students receive) and the annual yield (the percentage of admitted students who actually attend). The Director's independent variable is a private college's discount rate measured as a percentage, and the dependent variable is the college's annual yield measured as a percentage. The following results were obtained for a sample of 30 private colleges: x- Discount rate(percentage) - range: 35 to 72 percent y- Annual Yield(percentage) - range: 12 o 81 percent Σxi = 1612 Σyi = 898 Σxiyi = 44,377 Σxi2 = 89,790 Σyi2 = 35,704 a. Calculate the sample regression line's slope estimate. Interpret the sample regression line's slope estimate. b. Calculate the sample regression line's intercept estimate. Interpret the sample regression line's intercept estimate. Assume the following sum of...arrow_forward.7. Out of 70,000 literates in a particular district of India the number of criminals was 500. Out of 930,000 literates in the same district the number of criminals was 15,000. On the basis n 21 of these figures, do you find any association between illiteracy and criminality.arrow_forwardTest the following claims. This process should include each step as outlinedin the text In Mendel’s pea experiments, 6,022 yellow peas were observed out of a sample of8,023 peas. Test the claim, at 1% significance, that the proportion of these peas thatwere yellow is equal to 75%, against the alternative that the proportion is not 75%arrow_forward
arrow_back_ios
SEE MORE QUESTIONS
arrow_forward_ios
Recommended textbooks for you
- Text book imageMATLAB: An Introduction with ApplicationsStatisticsISBN:9781119256830Author:Amos GilatPublisher:John Wiley & Sons IncText book imageProbability and Statistics for Engineering and th...StatisticsISBN:9781305251809Author:Jay L. DevorePublisher:Cengage LearningText book imageStatistics for The Behavioral Sciences (MindTap C...StatisticsISBN:9781305504912Author:Frederick J Gravetter, Larry B. WallnauPublisher:Cengage Learning
- Text book imageElementary Statistics: Picturing the World (7th E...StatisticsISBN:9780134683416Author:Ron Larson, Betsy FarberPublisher:PEARSONText book imageThe Basic Practice of StatisticsStatisticsISBN:9781319042578Author:David S. Moore, William I. Notz, Michael A. FlignerPublisher:W. H. FreemanText book imageIntroduction to the Practice of StatisticsStatisticsISBN:9781319013387Author:David S. Moore, George P. McCabe, Bruce A. CraigPublisher:W. H. Freeman
Text book image
MATLAB: An Introduction with Applications
Statistics
ISBN:9781119256830
Author:Amos Gilat
Publisher:John Wiley & Sons Inc
Text book image
Probability and Statistics for Engineering and th...
Statistics
ISBN:9781305251809
Author:Jay L. Devore
Publisher:Cengage Learning
Text book image
Statistics for The Behavioral Sciences (MindTap C...
Statistics
ISBN:9781305504912
Author:Frederick J Gravetter, Larry B. Wallnau
Publisher:Cengage Learning
Text book image
Elementary Statistics: Picturing the World (7th E...
Statistics
ISBN:9780134683416
Author:Ron Larson, Betsy Farber
Publisher:PEARSON
Text book image
The Basic Practice of Statistics
Statistics
ISBN:9781319042578
Author:David S. Moore, William I. Notz, Michael A. Fligner
Publisher:W. H. Freeman
Text book image
Introduction to the Practice of Statistics
Statistics
ISBN:9781319013387
Author:David S. Moore, George P. McCabe, Bruce A. Craig
Publisher:W. H. Freeman