MATLAB: An Introduction with Applications
MATLAB: An Introduction with Applications
6th Edition
ISBN: 9781119256830
Author: Amos Gilat
Publisher: John Wiley & Sons Inc
expand_more
expand_more
format_list_bulleted
Bartleby Related Questions Icon
Related questions
Topic Video
Question
State the final conclusion that addresses the original claim.
(Reject/Fail) to Reject H0. There is (sufficient/not sufficient) evidence to conclude that the original claim that the mean of the population of student course evaluations is equal to 4.25 (is/is not) correct.
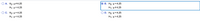
Transcribed Image Text:A data set includes data from student evaluations of courses. The summary statistics are n = 94, x = 4.11, s= 0.68. Use a 0.05 significance level to test the claim that the population of student
course evaluations has a mean equal to 4.25. Assume that a simple random sample has been selected. Identify the null and alternative hypotheses, test statistic, P-value, and state the final
conclusion that addresses the original claim.
Determine the test statistic.
(Round to two decimal places as needed.)
Determine the P-value.
(Round to three decimal places as needed.)
expand button
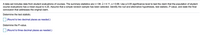
Transcribed Image Text:Ο Α. Ho: μ#4.25
Η: μ 4.25
B. Ho: μ= 4.25
Η1: μ#4.25
O c . H0: μ 4.25
Η: μ< 4.25
D. Ho : μ 4.25
H: μ> 4.25
Expert Solution
Check Markarrow_forward
Step 1
When n is large , we use Z test statistic. Formula and steps are given below.
bartleby
Trending nowThis is a popular solution!
bartleby
Step by stepSolved in 3 steps with 1 images
Knowledge Booster
Background pattern image
Learn more about
Need a deep-dive on the concept behind this application? Look no further. Learn more about this topic, statistics and related others by exploring similar questions and additional content below.Similar questions
- An ANOVA is used to evaluate the mean differences among three treatment conditions with a sample of n = 12 participants in each treatment. For this study, what is dfrotal? 2 11 35 33arrow_forwardSuppose you are interested in testing whether the mean earnings of men in the General Social Survey is representative of the earnings of the entire U.S. male population. The average male in the General Social Survey earned 31,607ドル in 2005 and the average male in the population earned 33,405ドル in 2005. State the null and research hypotheses. (you can write out your hypotheses using words, rather than use symbols if that's easier)arrow_forward(d) State the conclusion in context of the problem. There sufficient evidence at the a= 0.01 level of significance to conclude that the population mean is different from 24.arrow_forward
- A personality test has a subsection designed to assess the "honesty" of the test-taker. Suppose that you're interested in the mean score, U , on this subsection among the general population. You decide that you'll use the mean of a random sample of scores on this subsection to estimate U. What is the minimum sample size needed in order for you to be 90% confident that your estimate is within 5 of U? Use the value of 20 for the population standard deviation of scores on this subsection. Carry your intermediate computations to at least three decimal places. Write your answer as a whole number (and make sure that it is the minimum whole number that satisfies the requirements). (If necessary, consult a list of formulas.)arrow_forwardA personality test has a subsection designed to assess the "honesty" of the test-taker. Suppose that you're interested in the mean score, μ , on this subsection among the general population. You decide that you'll use the mean of a random sample of scores on this subsection to estimate μ . What is the minimum sample size needed in order for you to be 95% confident that your estimate is within 4 of μ ? Use the value 23 for the population standard deviation of scores on this subsection. Carry your intermediate computations to at least three decimal places. Write your answer as a whole number (and make sure that it is the minimum whole number that satisfies the requirements).arrow_forwardA test (Test A) was developed as a possible replacement for an old stat test (Test B). An stat test claimed that mean time to finishe the new test A was more than the mean time to finish an old test B. The summary data for completion time (in minutes) are as follows. Test A : n=7, X bar=158 minutes, S2=165 minutes Test B : n=11 X bar=152 minutes, S2=33 minutes Estimate of standard error=16 P=value: Use t-distribution, tp-value is equal to 0.1307 for one tailed test. P-value 0.1307> significance level a=0.10, fail 2 reject. So there is not enough evidence to support the claim that mean time to complete the new test A is more than the meantime to complete old test B.arrow_forward
- 5arrow_forwardA data set includes times (in minutes) of taxi cab rides in New York City yellow cabs during a Friday morning of the same day in a recent year. Using 33 of the times to test the claim that the mean of all such times is less than 15 minutes, the accompanying Minitab display is obtained. Test the given claim by using the display provided from Minitab. Use a 0.05 significance level. O Click the icon to view the Minitab display. Identily the null and alternative hypotheses. Họ: Hy: (Type integers or decimals. Do not round.)arrow_forwardAnswer the following True or False: If the p-value is 0.13 and the level of significance , a , is 0.05 in a hypothesis test for a mean, then we accept the null hypothesis. true falsearrow_forward
- 2.103 Exercise and adequate sleep. A survey of 656 boys and girls, who were 13 to 18 years old, asked about adequate sleep and other health-related behaviors. The recommended amount of sleep is six to eight hours per night. 30 In the survey, 59% of the respondents reported that they got less than this amount of sleep on school nights. An exercise scale was developed and used to classify the students as above or below the median in this domain. Here is the 2 ×ばつ 2 table of counts with students classified as getting or not getting adequate sleep and by the exercise variable: Lil, SLEEPioos s diiw enoilatn.adtlo noowiod noisioozzs or ovenolw.ovitipog os Exercise Enough sleep High Low Yes 151 115 othe are No 148 242 habit and no noiarrow_forward3.)arrow_forwardA data set includes times (in minutes) of taxi cab rides in New York City yellow cabs during a Friday morning of the same day in a recent year. Using 38 of the times to test the claim that the mean of all such times is less than 15 minutes, the accompanying Minitab display is obtained. Test the given claim by using the display provided from Minitab. Use a 0.05 significance level. Answer The Last Question in Picture: State the conclusion about the null hypothesis, as well as the final conclusion that addresses the original claim FILL IN THE BANKSarrow_forward
arrow_back_ios
SEE MORE QUESTIONS
arrow_forward_ios
Recommended textbooks for you
- Text book imageMATLAB: An Introduction with ApplicationsStatisticsISBN:9781119256830Author:Amos GilatPublisher:John Wiley & Sons IncText book imageProbability and Statistics for Engineering and th...StatisticsISBN:9781305251809Author:Jay L. DevorePublisher:Cengage LearningText book imageStatistics for The Behavioral Sciences (MindTap C...StatisticsISBN:9781305504912Author:Frederick J Gravetter, Larry B. WallnauPublisher:Cengage Learning
- Text book imageElementary Statistics: Picturing the World (7th E...StatisticsISBN:9780134683416Author:Ron Larson, Betsy FarberPublisher:PEARSONText book imageThe Basic Practice of StatisticsStatisticsISBN:9781319042578Author:David S. Moore, William I. Notz, Michael A. FlignerPublisher:W. H. FreemanText book imageIntroduction to the Practice of StatisticsStatisticsISBN:9781319013387Author:David S. Moore, George P. McCabe, Bruce A. CraigPublisher:W. H. Freeman
Text book image
MATLAB: An Introduction with Applications
Statistics
ISBN:9781119256830
Author:Amos Gilat
Publisher:John Wiley & Sons Inc
Text book image
Probability and Statistics for Engineering and th...
Statistics
ISBN:9781305251809
Author:Jay L. Devore
Publisher:Cengage Learning
Text book image
Statistics for The Behavioral Sciences (MindTap C...
Statistics
ISBN:9781305504912
Author:Frederick J Gravetter, Larry B. Wallnau
Publisher:Cengage Learning
Text book image
Elementary Statistics: Picturing the World (7th E...
Statistics
ISBN:9780134683416
Author:Ron Larson, Betsy Farber
Publisher:PEARSON
Text book image
The Basic Practice of Statistics
Statistics
ISBN:9781319042578
Author:David S. Moore, William I. Notz, Michael A. Fligner
Publisher:W. H. Freeman
Text book image
Introduction to the Practice of Statistics
Statistics
ISBN:9781319013387
Author:David S. Moore, George P. McCabe, Bruce A. Craig
Publisher:W. H. Freeman