A First Course in Probability (10th Edition)
A First Course in Probability (10th Edition)
10th Edition
ISBN: 9780134753119
Author: Sheldon Ross
Publisher: PEARSON
expand_more
expand_more
format_list_bulleted
Bartleby Related Questions Icon
Related questions
Topic Video
Question
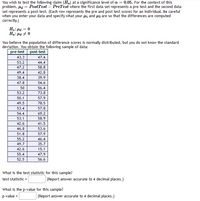
Transcribed Image Text:You wish to test the following claim (Ha) at a significance level of a = 0.05. For the context of this
problem, Ha = PostTest – PreTest where the first data set represents a pre-test and the second data
set represents a post-test. (Each row represents the pre and post test scores for an individual. Be careful
when you enter your data and specify what your ui and μz are so that the differences are computed
correctly.)
Ho: Hd = 0
Ha: Hd + 0
You believe the population of difference scores is normally distributed, but you do not know the standard
deviation. You obtain the following sample of data:
pre-test post-test
43.3
47.4
53.2
44.4
47.2
58.8
49.4
42.8
38.4
39.9
47.8
54.6
50
56.4
53.2
73.8
50.1
57.9
49.5
78.5
53.4
57.8
54.4
69.2
53.1
58.9
42.6
41.5
46.8
53.6
51.8
57.9
55.2
46.4
49.7
35.7
42.6
15.1
55.4
47.9
52.5
56.6
What is the test statistic for this sample?
test statistic =
(Report answer accurate to 4 decimal places.)
What is the p-value for this sample?
p-value =
(Report answer accurate to 4 decimal places.)
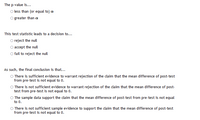
Transcribed Image Text:The p-value is...
O less than (or equal to) a
O greater than a
This test statistic leads to a decision to...
O reject the null
accept the null
O fail to reject the null
As such, the final conclusion is that...
O There is sufficient evidence to warrant rejection of the claim that the mean difference of post-test
from pre-test is not equal to 0.
O There is not sufficient evidence to warrant rejection of the claim that the mean difference of post-
test from pre-test is not equal to 0.
O The sample data support the claim that the mean difference of post-test from pre-test is not equal
to 0.
There is not sufficient sample evidence to support the claim that the mean difference of post-test
from pre-test is not equal to 0.
Expert Solution
Check MarkThis question has been solved!
Explore an expertly crafted, step-by-step solution for a thorough understanding of key concepts.
bartleby
This is a popular solution
bartleby
Trending nowThis is a popular solution!
bartleby
Step by stepSolved in 2 steps with 2 images
Knowledge Booster
Background pattern image
Learn more about
Need a deep-dive on the concept behind this application? Look no further. Learn more about this topic, probability and related others by exploring similar questions and additional content below.Similar questions
- The number of people in each subgroup was not readily available in the article, but we'lI use the following table as an estimate. Younger Americans (ages 18 to 29) Americans with Americans college degrees sample size know a recent immigrant 3100 1200 600 24% 33% 36% For both of the following, clearly label the steps of your hypothesis test, including Stating the null and alternative hypotheses. Both of the following scenarios should be two-tailed tests. Determining the mean and standard error of the sampling distribution based on the null hypothesis Calculating the p-value for the sample statistics Drawing conclusions in both statistical language and common language tied to the original context. Part A: Conduct a hypothesis test for the null hypothesis that the proportion of Americans who know a recent immigrant is the same for Americans with college degrees and Americans general. Part B: Is there a difference in the chance an American will know a recent immigrant depending on whether...arrow_forwardno one cag get this pleSEarrow_forwardData on the weights of the contents of cans of diet soda versus the contents of cans of regular soda is summarized in the table. Assume that the two samples are independent simple random samples selected from normally distributed populations, and do not assume that the population standard deviations are equal. A. Test the claim that the contents of cans of diet soda have weights with a mean that is less than the mean for the regular soda. What are the null and alternative hypotheses? The test statistic, t, is? The p value is? Round three decimal places as neededarrow_forward
- In a random sample of males, it was found that 21 write with their left hands and 224 do not. In a random sample of females, it was found that 67 write with the left hands and 448 do not. Use a 0.01 significance level to test the claim that the rate of left-handedness among males is less than that among females. Complete parts (a) through (c) below. OF. Ho Pt P2 H P1arrow_forward4... State the null hypothesis, Ho, and the alternative hypothesis, Ha, that would be used to test each of the following claims. (a) The mean weight of honeybees is at least 11 grams. Ho: ? ---Select--- equal to greater than less than not equal to 11 Ha: ? ---Select--- equal to greater than less than not equal to 11 (b) The mean age of patients at Memorial Hospital is no more than 54 years. Ho: u ---Select--- equal to greater than less than not equal to 54 Ha: u ---Select--- equal to greater than less than not equal to 54 (c) The mean amount of salt in granola snack bars is 75 mg. Ho: u ---Select--- equal to greater than less than not equal to 75 Ha: u ---Select--- equal to greater than less than not equal to 75arrow_forwardI cannot find the test statistic for the image of the problemarrow_forwardThe work week for adults in the US that work full time is normally distributed with a mean of 47 hours. A newly hired engineer at a start-up company believes that employees at start-up companies work more on average then most working adults in the US. She asks 12 engineering friends at start-ups for the lengths in hours of their work week. Their responses are shown in the table below. Test the claim using a 5% level of significance. Give answer to at least 4 decimal places. Hours 45 46 59 54 49 60 54 50 50 45 51 55 (a) Determine the null and alternative hypotheses? Ho: Select an answer hours H1: Select an answer hours (b) Determine the test statistic ? v (c) Determine the p-value. p-value =arrow_forwardWhich of the following is FALSE of nonparametric tests? A. Nonparamentric tests can use nominal level data. B. tests include the chi-squared and Kruskal-Wallis tests. C. Nonparamentric tests are less powerful than parametric tests. D. Nonparametic tests require normal distribution of the variables.arrow_forwardYou wish to test the following claim (Ha) at a significance level of a 0.001. Ho: P1 = P2 Ha: P1> P2 You obtain 45.9% successes in a sample of size n1 = 573 from the first population. You obtain 42.3% successes in a sample of size n2 = 317 from the second population. Round values for X to the nearest whole number. What is the test statistic for this sample? (Round to three decimal places.) test statistic = What is the p-value for this sample? (Round to four decimal places.) p-value =arrow_forwardOne personality test available on the World Wide Web has a subsection designed to assess the "honesty" of the test-taker. You are interested in the mean score, μ, among the general population on this subsection. The website reports that μ is 142, but you have good reason to believe that μ differs from 142. You decide to do a statistical test. You choose a random sample of people and have them take the personality test. You find that their mean score on the subsection is 146 and that the standard deviation of their scores is 28. Based on this information, complete the parts below. (a) What are the null hypothesis Ho and the alternative hypothesis H1 that should be used for the test? H2:0 H1 (b) Suppose that you decide not to reject the null hypothesis. What sort of error might you be making? (Choose one) Type I (c) S Type II Type I error. jean score among the general population on the subsection is 142. Fill in the blanks to describe a μ OO 0=0 0#0 5arrow_forwardQ According to a recent article about individuals who have credit cards, the mean number of cards per person with credit cards is 4. To test this result a random survey of 60 individuals who have credit cards was conducted. The survey only includes the number of credit cards per participant. The results of the survey are attached below. (a) What is the variable of interest in this study? Is it qualitative or quantitative? (b) Do the results of the survey imply that the mean number of cards per individual is less than 4? Use the a= 0.05 level of significance. Click the icon to view the data from the survey. C (a) What is the variable of interest in this study? Is it qualitative or quantitative? The variable of interest is It is a ▼variable. D Clear all Check answer Help me solve this View an example Get more help. 5:42 PM 6/18/2022 E Type here to search 3 7 S X E D C "42 $ R F % 5 T G 40 6 B Y H N C N 8 J M 9 K P 97°F Mostly sunny delete prt sc end 7 1arrow_forwardFor the last sentence / first blank is choices in/not in . second blank is fail to reject/ reject third blank is is not /isarrow_forwardarrow_back_iosSEE MORE QUESTIONSarrow_forward_ios
Recommended textbooks for you
- Text book imageA First Course in Probability (10th Edition)ProbabilityISBN:9780134753119Author:Sheldon RossPublisher:PEARSONText book image
Text book image
A First Course in Probability (10th Edition)
Probability
ISBN:9780134753119
Author:Sheldon Ross
Publisher:PEARSON
Text book image