MATLAB: An Introduction with Applications
MATLAB: An Introduction with Applications
6th Edition
ISBN: 9781119256830
Author: Amos Gilat
Publisher: John Wiley & Sons Inc
expand_more
expand_more
format_list_bulleted
Bartleby Related Questions Icon
Related questions
Question
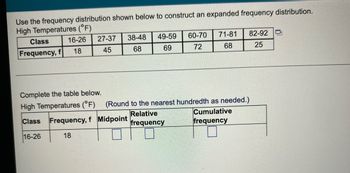
Transcribed Image Text:Use the frequency distribution shown below to construct an expanded frequency distribution.
High Temperatures (°F)
Class
16-26
27-37
60-70 71-81 82-92
38-48 49-59
18
45
68
69
72
68
Frequency, f
25
Complete the table below.
High Temperatures (°F) (Round to the nearest hundredth as needed.)
Relative
Cumulative
Class Frequency, f Midpoint
frequency
frequency
16-26
18
Expert Solution
Check MarkThis question has been solved!
Explore an expertly crafted, step-by-step solution for a thorough understanding of key concepts.
bartleby
This is a popular solution
bartleby
Trending nowThis is a popular solution!
bartleby
Step by stepSolved in 2 steps with 2 images
Knowledge Booster
Background pattern image
Similar questions
- The following is a Frequency Distribution Table for the number of units 40 MPC students are enrolled in for this Summer session. Fill in the Relative Frequency for each class in the table above. Type in your solution as a decimal. Class Limits Frequency Relative Frequency 0.1 - 1.5 10 1.6 - 3.0 14 3.1 - 4.5 8 4.6 - 6.0 6 6.1 - 7.5 2arrow_forwardFollowing simple frequency table describes the information for police response times. Minutes °f (X) 14 4 8 3 5 2 1 1 Total 14+8+5+1+2 What is the mode of this simple frequency table?arrow_forwardFinish times (to the nearest hour) for 10 dogsled teams are shown below. Make a frequency table showing class limits, class boundaries, midpoints, frequency, relative frequencies, and cumulative frequencies. Use three classes. The class size of the given data is 24. (Round your answer for relative frequency to the nearest hundredth and for midpoint to the nearest tenth.) 262 236 272 256 294 242 288 258 284 310arrow_forward
- Given frequency distribution depicts the scores on a math test. Scores Number of students 60--69 70--79 80--89 25 90--99 7. Find the class midpoints for class 80--89 Find the class widtharrow_forwardFind the Midpointarrow_forwardThe table below is a frequency distribution for how much employees spend on health care every year. Construct the histogram for it. Dollars frequency 650-759 6 760-869 33 870-979 28 980-1089 11 1090-1199 7 1200-1309 4 1310-1419 2 b)Once you created the histogram answer what pattern does it have, normal, skewed right or left.arrow_forward
- look at the image Create a frequency distribution table for the following data. Show all of your work.arrow_forwardUse the frequency distribution shown below to construct an expanded frequency distribution. High Temperatures (°F) Class 17-27 28-38 39-49 50-60 61-71 72-82 83-93 Frequency, f 17 41 68 69 76 68 26 Complete the table below. High Temperatures (°F) (Round to the nearest hundredth as needed.) Cumulative frequency Class Frequency, f Midpoint Relative frequency 17-27 17arrow_forwardA professor records the following final grades in one course. Construct a frequency table for the grades. A A A A B B B B C C C C D D A C B C C BD 4F F Complete the table. (Type an integer or decimal rounded to the nearest tenth as needed.) Grade Frequency Relative frequency Cumulative frequency A % 0arrow_forward
- The response to a question has three alternatives: A, B, and C. A sample of 120 responses provides 54 A, 30 B, and 36 C. Show the frequency and relative frequency distributions (use 2 decimal for the relative frequency column). Frequency Class A B Relative Frequency C Totalarrow_forwardThe Practice of Statistics sixth edition section 1.1 question number 13arrow_forwardPlease help me locate the frequency distributionarrow_forward
arrow_back_ios
SEE MORE QUESTIONS
arrow_forward_ios
Recommended textbooks for you
- Text book imageMATLAB: An Introduction with ApplicationsStatisticsISBN:9781119256830Author:Amos GilatPublisher:John Wiley & Sons IncText book imageProbability and Statistics for Engineering and th...StatisticsISBN:9781305251809Author:Jay L. DevorePublisher:Cengage LearningText book imageStatistics for The Behavioral Sciences (MindTap C...StatisticsISBN:9781305504912Author:Frederick J Gravetter, Larry B. WallnauPublisher:Cengage Learning
- Text book imageElementary Statistics: Picturing the World (7th E...StatisticsISBN:9780134683416Author:Ron Larson, Betsy FarberPublisher:PEARSONText book imageThe Basic Practice of StatisticsStatisticsISBN:9781319042578Author:David S. Moore, William I. Notz, Michael A. FlignerPublisher:W. H. FreemanText book imageIntroduction to the Practice of StatisticsStatisticsISBN:9781319013387Author:David S. Moore, George P. McCabe, Bruce A. CraigPublisher:W. H. Freeman
Text book image
MATLAB: An Introduction with Applications
Statistics
ISBN:9781119256830
Author:Amos Gilat
Publisher:John Wiley & Sons Inc
Text book image
Probability and Statistics for Engineering and th...
Statistics
ISBN:9781305251809
Author:Jay L. Devore
Publisher:Cengage Learning
Text book image
Statistics for The Behavioral Sciences (MindTap C...
Statistics
ISBN:9781305504912
Author:Frederick J Gravetter, Larry B. Wallnau
Publisher:Cengage Learning
Text book image
Elementary Statistics: Picturing the World (7th E...
Statistics
ISBN:9780134683416
Author:Ron Larson, Betsy Farber
Publisher:PEARSON
Text book image
The Basic Practice of Statistics
Statistics
ISBN:9781319042578
Author:David S. Moore, William I. Notz, Michael A. Fligner
Publisher:W. H. Freeman
Text book image
Introduction to the Practice of Statistics
Statistics
ISBN:9781319013387
Author:David S. Moore, George P. McCabe, Bruce A. Craig
Publisher:W. H. Freeman