MATLAB: An Introduction with Applications
MATLAB: An Introduction with Applications
6th Edition
ISBN: 9781119256830
Author: Amos Gilat
Publisher: John Wiley & Sons Inc
expand_more
expand_more
format_list_bulleted
Bartleby Related Questions Icon
Related questions
Question
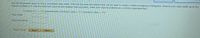
Transcribed Image Text:Use the information given to find a convenient class width. Then list the class boundaries that can be used to create a relative frequency histogram. (Round your class width up to the
nearest multiple of 5. Use the minimum value as the smallest class boundary. Enter your class boundaries as a comma separated list.)
8 classes forn = 75 measurements; minimum value = 50; maximum value = 205
II
class width
class boundaries
Need Help?
Read It
Watch It
Expert Solution
Check MarkThis question has been solved!
Explore an expertly crafted, step-by-step solution for a thorough understanding of key concepts.
bartleby
This is a popular solution
bartleby
Trending nowThis is a popular solution!
bartleby
Step by stepSolved in 3 steps
Knowledge Booster
Background pattern image
Learn more about
Need a deep-dive on the concept behind this application? Look no further. Learn more about this topic, statistics and related others by exploring similar questions and additional content below.Similar questions
- Please do not give solution in image format thanku A car salesman collected data on how many cars were sold at a dealership per day for two weeks. The results were as follows: 6, 7, 4, 3, 1, 2, 6, 6, 6, 7, 4, 4. Make a frequency table and then make a histogram based on that frequency table. What is the shape of the distribution? O Skewed to the right O Skewed to the left O Bimodal O Symmetricalarrow_forwardWhat are the relative frequenciesarrow_forwardNc Please don't provide the handwriting solutionarrow_forward
- Consider the woman's 100 Your - and the subsequent 100 meter - in the Olympics since records have been kept determined the best way to combine all the data in depict the data would you use a histogram A-line graph a stem and leaf plot or a scatterplotarrow_forwardWhich of these can help you visualize data? Select all that apply. O bank statement O circle graph O spreadsheet O table O bar grapharrow_forwardPlease solve and explain #2arrow_forward
- the box plot represents the average temperature in seattle for each day in august. what is the interquartile range of the dataarrow_forwardFinish times (to the nearest hour) for 10 dogsled teams are shown below. Make a frequency table showing class limits, class boundaries, midpoints, frequency, relative frequencies, and cumulative frequencies. Use three classes. (Round your answer for relative frequency to the nearest hundredth and for midpoint to the nearest tenth.) 308 262 310 268 299 249 257 286 239 278arrow_forwardFinish times (to the nearest hour) for 10 dogsled teams are shown below. Make a frequency table showing class limits, class boundaries, midpoints, frequency, relative frequencies, and cumulative frequencies. Use three classes. The class size of the given data is 24. (Round your answer for relative frequency to the nearest hundredth and for midpoint to the nearest tenth.) 262 236 272 256 294 242 288 258 284 310arrow_forward
- DataValues 5 9 43 75 77 78 96 98 100 What is the 5th decile?arrow_forwardPlease circle answerarrow_forwardThe table shows the magnitudes of the earthquakes that have occurred in the past 10 years. Use the frequency distribution to construct a histogram. Does the histogram appear to be skewed? If so, identify the type of skewness. Construct the histogram. Choose the correct graph below. OA. 15- 10- 5- 0- 6 10 Earthquake magnitude Earthquake Magnitude Frequency Frequency The histogram Earthquake magnitude 5.0-5.9 6.0-6.9 7.0-7.9 8.0-8.9 9.0-9.9 O B. O D. 10 ▼so the distribution of the data is Frequency Frequency Frequency 14 13. 8 4 1 ܗ ܘ ܗ ܘ ܂ 15- ܩ ܘ ܩ SOSO 15 10- 5- 0- Earthquake Magnitude 9 Earthquake magnitude 10 10arrow_forward
arrow_back_ios
SEE MORE QUESTIONS
arrow_forward_ios
Recommended textbooks for you
- Text book imageMATLAB: An Introduction with ApplicationsStatisticsISBN:9781119256830Author:Amos GilatPublisher:John Wiley & Sons IncText book imageProbability and Statistics for Engineering and th...StatisticsISBN:9781305251809Author:Jay L. DevorePublisher:Cengage LearningText book imageStatistics for The Behavioral Sciences (MindTap C...StatisticsISBN:9781305504912Author:Frederick J Gravetter, Larry B. WallnauPublisher:Cengage Learning
- Text book imageElementary Statistics: Picturing the World (7th E...StatisticsISBN:9780134683416Author:Ron Larson, Betsy FarberPublisher:PEARSONText book imageThe Basic Practice of StatisticsStatisticsISBN:9781319042578Author:David S. Moore, William I. Notz, Michael A. FlignerPublisher:W. H. FreemanText book imageIntroduction to the Practice of StatisticsStatisticsISBN:9781319013387Author:David S. Moore, George P. McCabe, Bruce A. CraigPublisher:W. H. Freeman
Text book image
MATLAB: An Introduction with Applications
Statistics
ISBN:9781119256830
Author:Amos Gilat
Publisher:John Wiley & Sons Inc
Text book image
Probability and Statistics for Engineering and th...
Statistics
ISBN:9781305251809
Author:Jay L. Devore
Publisher:Cengage Learning
Text book image
Statistics for The Behavioral Sciences (MindTap C...
Statistics
ISBN:9781305504912
Author:Frederick J Gravetter, Larry B. Wallnau
Publisher:Cengage Learning
Text book image
Elementary Statistics: Picturing the World (7th E...
Statistics
ISBN:9780134683416
Author:Ron Larson, Betsy Farber
Publisher:PEARSON
Text book image
The Basic Practice of Statistics
Statistics
ISBN:9781319042578
Author:David S. Moore, William I. Notz, Michael A. Fligner
Publisher:W. H. Freeman
Text book image
Introduction to the Practice of Statistics
Statistics
ISBN:9781319013387
Author:David S. Moore, George P. McCabe, Bruce A. Craig
Publisher:W. H. Freeman