MATLAB: An Introduction with Applications
MATLAB: An Introduction with Applications
6th Edition
ISBN: 9781119256830
Author: Amos Gilat
Publisher: John Wiley & Sons Inc
expand_more
expand_more
format_list_bulleted
Bartleby Related Questions Icon
Related questions
Question
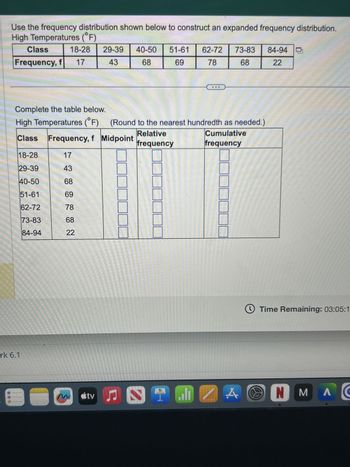
Transcribed Image Text:Use the frequency distribution shown below to construct an expanded frequency distribution.
High Temperatures (°F)
18-28 29-39 40-50 51-61 62-72 73-83 84-94
Class
Frequency, f 17
43
68
69
78
68
22
Complete the table below.
High Temperatures (°F) (Round to the nearest hundredth as needed.)
Cumulative
frequency
Class Frequency, f Midpoint
Relative
frequency
18-28
17
29-39
43
40-50
68
51-61
69
62-72
78
73-83
68
84-94
22
rk 6.1
M
Time Remaining: 03:05:1
tv
A
NM
Λ
SAVE
AI-Generated Solution
info
AI-generated content may present inaccurate or offensive content that does not represent bartleby’s views.
bartleby
Unlock instant AI solutions
Tap the button
to generate a solution
to generate a solution
Click the button to generate
a solution
a solution
Knowledge Booster
Background pattern image
Similar questions
- Use the cumulative frequency table on the left(top) to fill in the table on the right.(bottom) Classes Cumulative Frequency Under 10 7 Under 20 19 Under 30 38 Under 40 55 Under 50 60 Classes Frequency Relative Frequency 0-9 10-19 20-29 30-39 40-49arrow_forwardUse the frequency distribution shown below to construct an expanded frequency distribution. High Temperatures (°F) 17-27 28-38 39-49 50-60 61-71 72-82 68 45 69 76 68 Class Frequency, f 18 Complete the table below. High Temperatures (°F) (Round to the nearest hundredth as needed.) Relative Cumulative Class Frequency, f Midpoint frequency frequency 17-27 18 83-93 21 Carrow_forwardNumber 1arrow_forward
- describe the steps you would take to construct a frequency distributionarrow_forwardUse the Histogram tool to develop a frequency distribution and histogram for the number of months as a customer of the bank in the data below. Compute the relative and cumulative relative frequencies and use a line chart to construct an ogive. Complete the frequency distribution for the months as a customer, and compute the relative and cumulative relative frequencies. (Type integers or decimals rounded to three decimal places as needed.) Bins Frequency Relative Frequency Cumulative Relative Frequency 10 enter your response here enter your response here enter your response here 20 enter your response here enter your response here enter your response here 30 enter your response here enter your response here enter your response here 40 enter your response here enter your response here enter your response here 50 enter your response here enter your response here enter your...arrow_forwardChearrow_forward
- Use the frequency distribution shown below to construct an expanded frequency distribution. High Temperatures (°F) Class 16-26 27-37 60-70 71-81 82-92 38-48 49-59 18 45 68 69 72 68 Frequency, f 25 Complete the table below. High Temperatures (°F) (Round to the nearest hundredth as needed.) Relative Cumulative Class Frequency, f Midpoint frequency frequency 16-26 18arrow_forwardScore: 0/6 0/6 answered Question 1 The following data represents the age of 30 lottery winners. 23 29 29 32 37 37 38 38 39 42 43 45 45 46 47 48 57 58 58 59 64 65 67 68 71 72 73 75 79 82 Complete the frequency distribution for the data. Age Frequency 20-29 30-39 40-49 50-59 60-69 70-79 80-89 Question Help: Message instructor Submit Questionarrow_forwardCORStruct a frequency distribution for the g class has the greatest frequency and whicarrow_forward
arrow_back_ios
arrow_forward_ios
Recommended textbooks for you
- Text book imageMATLAB: An Introduction with ApplicationsStatisticsISBN:9781119256830Author:Amos GilatPublisher:John Wiley & Sons IncText book imageProbability and Statistics for Engineering and th...StatisticsISBN:9781305251809Author:Jay L. DevorePublisher:Cengage LearningText book imageStatistics for The Behavioral Sciences (MindTap C...StatisticsISBN:9781305504912Author:Frederick J Gravetter, Larry B. WallnauPublisher:Cengage Learning
- Text book imageElementary Statistics: Picturing the World (7th E...StatisticsISBN:9780134683416Author:Ron Larson, Betsy FarberPublisher:PEARSONText book imageThe Basic Practice of StatisticsStatisticsISBN:9781319042578Author:David S. Moore, William I. Notz, Michael A. FlignerPublisher:W. H. FreemanText book imageIntroduction to the Practice of StatisticsStatisticsISBN:9781319013387Author:David S. Moore, George P. McCabe, Bruce A. CraigPublisher:W. H. Freeman
Text book image
MATLAB: An Introduction with Applications
Statistics
ISBN:9781119256830
Author:Amos Gilat
Publisher:John Wiley & Sons Inc
Text book image
Probability and Statistics for Engineering and th...
Statistics
ISBN:9781305251809
Author:Jay L. Devore
Publisher:Cengage Learning
Text book image
Statistics for The Behavioral Sciences (MindTap C...
Statistics
ISBN:9781305504912
Author:Frederick J Gravetter, Larry B. Wallnau
Publisher:Cengage Learning
Text book image
Elementary Statistics: Picturing the World (7th E...
Statistics
ISBN:9780134683416
Author:Ron Larson, Betsy Farber
Publisher:PEARSON
Text book image
The Basic Practice of Statistics
Statistics
ISBN:9781319042578
Author:David S. Moore, William I. Notz, Michael A. Fligner
Publisher:W. H. Freeman
Text book image
Introduction to the Practice of Statistics
Statistics
ISBN:9781319013387
Author:David S. Moore, George P. McCabe, Bruce A. Craig
Publisher:W. H. Freeman