MATLAB: An Introduction with Applications
MATLAB: An Introduction with Applications
6th Edition
ISBN: 9781119256830
Author: Amos Gilat
Publisher: John Wiley & Sons Inc
expand_more
expand_more
format_list_bulleted
Bartleby Related Questions Icon
Related questions
Question
The purpose of this assignment is to learn to organize and present statistical data by using frequency distribution. You need to know how to get the number of class, class interval, and class limits. For quantitative data, get frequency distribution, relative frequency, percent frequency, and cumulative frequency. Refer to the table attached and answer the following questions:
- Comment on the shape of the distribution. Interpret the pattern of how CEOs spend their day in meetings.
- Upload the final frequency distribution table.
expand button
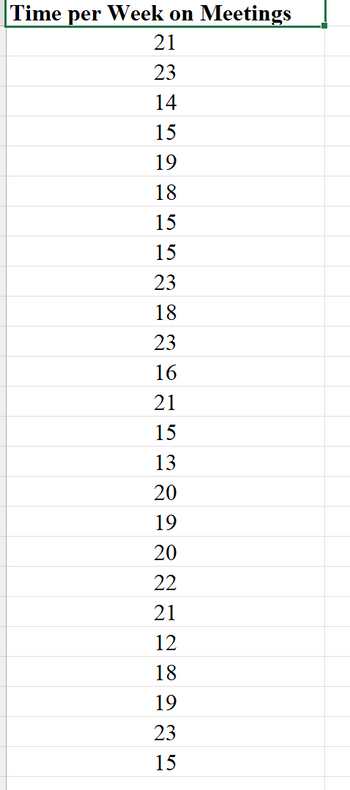
Transcribed Image Text:Time per Week on Meetings
21
23
14
15
19
18
15
15
23
18
23
16
21
15
13
20
19
20
22
21
12
18
19
23
15
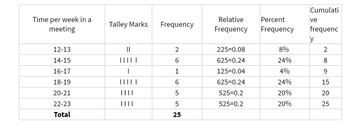
Transcribed Image Text:Time per week in a
meeting
12-13
14-15
16-17
18-19
20-21
22-23
Total
Talley Marks
||
|||||
I
|||| |
||||
||||
Frequency
6
1
6
5
5
25
Relative
Frequency
225=0.08
625-0.24
125=0.04
625-0.24
525-0.2
525=0.2
Percent
Frequency
8%
24%
4%
24%
20%
20%
Cumulati
ve
frequenc
y
2
8
9
15
20
25
Expert Solution
Check Markarrow_forward
Step 1
Statistics homework question answer, step 1, image 1
bartleby
Step by stepSolved in 4 steps with 4 images
Knowledge Booster
Background pattern image
Similar questions
- State whether you would expect the data set to be normally distributed.Amount of credit card debt of families in the U.S. Normal Not normalarrow_forwardPlease only do B, C, and D...arrow_forwardMake frequency tables for the following data sets. Include columns for relative and cumulative frequency. Also, make a bar graph for the frequency. A website that reviews recent movies lists 5 five-star films (the highest rating), 15 four-star films, 15 three-star films, 10 two-star films, and 5 one-star films.arrow_forward
- Answer it correctly please. I ll rate accordingly with multiple votes. Explain well and Typed answer only.arrow_forwardCan you create a five number summary of the data set?arrow_forwardBackground: You just finished teaching your first PSYCH 248 lab section, and it’s time to calculate the grades. Your wonderful teaching assistant created an Excel file with all of the students’ exam grades, homework grade, and lab grade as well as their gender. Your next steps are to calculate each student’s final grade, convert those scores to letter grades, and describe the distribution of scores. 2. In Excel, calculate the final Number Grade, Letter Grade, and Z-score for each student. a. To calculate the Number Grade, type a numerical equation after an = sign in a cell or use the =AVERAGE() formula; however, keep in mind that the =AVERAGE() formula will always give you the regular mean, not the weighted mean. Grades for this course are comprised of three parts: lecture exams (60%), homework (20%), and lab (20%). b. To calculate the Letter Grade, use the =IF() formulawith a series of logic statements or enter the data by hand. For this assignment, let’s convert Number Grade into...arrow_forward
- Explain the meaning of the specified term. Distribution of a data setarrow_forwardWhat is the difference between relative frequency and cumulative frequency? Choose the correct answer below. A. Relative frequency of a class is the number of observations in that class, while cumulative frequency of a class is the sum of all the frequencies. B. Relative frequency of a class is the proportion of the data in that class, while cumulative frequency of a class is the number of observations in that class. C. Relative frequency of a class is the percentage of the data that falls in that class, while cumulative frequency of a class is the sum of the frequencies of that class and all previous classes. O D. There is no difference between the two.arrow_forwardBriefly explain the procedure you may adopt to summarize data set obtained from field study.arrow_forward
arrow_back_ios
SEE MORE QUESTIONS
arrow_forward_ios
Recommended textbooks for you
- Text book imageMATLAB: An Introduction with ApplicationsStatisticsISBN:9781119256830Author:Amos GilatPublisher:John Wiley & Sons IncText book imageProbability and Statistics for Engineering and th...StatisticsISBN:9781305251809Author:Jay L. DevorePublisher:Cengage LearningText book imageStatistics for The Behavioral Sciences (MindTap C...StatisticsISBN:9781305504912Author:Frederick J Gravetter, Larry B. WallnauPublisher:Cengage Learning
- Text book imageElementary Statistics: Picturing the World (7th E...StatisticsISBN:9780134683416Author:Ron Larson, Betsy FarberPublisher:PEARSONText book imageThe Basic Practice of StatisticsStatisticsISBN:9781319042578Author:David S. Moore, William I. Notz, Michael A. FlignerPublisher:W. H. FreemanText book imageIntroduction to the Practice of StatisticsStatisticsISBN:9781319013387Author:David S. Moore, George P. McCabe, Bruce A. CraigPublisher:W. H. Freeman
Text book image
MATLAB: An Introduction with Applications
Statistics
ISBN:9781119256830
Author:Amos Gilat
Publisher:John Wiley & Sons Inc
Text book image
Probability and Statistics for Engineering and th...
Statistics
ISBN:9781305251809
Author:Jay L. Devore
Publisher:Cengage Learning
Text book image
Statistics for The Behavioral Sciences (MindTap C...
Statistics
ISBN:9781305504912
Author:Frederick J Gravetter, Larry B. Wallnau
Publisher:Cengage Learning
Text book image
Elementary Statistics: Picturing the World (7th E...
Statistics
ISBN:9780134683416
Author:Ron Larson, Betsy Farber
Publisher:PEARSON
Text book image
The Basic Practice of Statistics
Statistics
ISBN:9781319042578
Author:David S. Moore, William I. Notz, Michael A. Fligner
Publisher:W. H. Freeman
Text book image
Introduction to the Practice of Statistics
Statistics
ISBN:9781319013387
Author:David S. Moore, George P. McCabe, Bruce A. Craig
Publisher:W. H. Freeman