MATLAB: An Introduction with Applications
MATLAB: An Introduction with Applications
6th Edition
ISBN: 9781119256830
Author: Amos Gilat
Publisher: John Wiley & Sons Inc
expand_more
expand_more
format_list_bulleted
Bartleby Related Questions Icon
Related questions
Question
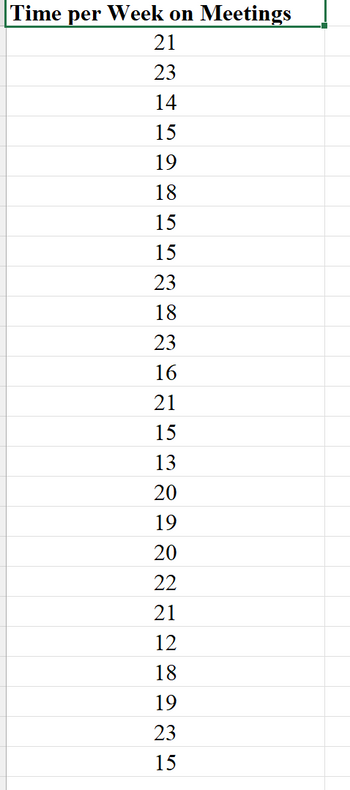
The purpose of this assignment is to learn to organize and present statistical data by using frequency distribution. You need to know how to get the number of class, class interval, and class limits. For quantitative data, get frequency distribution, relative frequency, percent frequency, and cumulative frequency. Refer to the table attached and answer the following questions:
- Calculate the number of classes by using class width of two hours.
- Set the lower class limit of the first class to include the lowest amount of time spent I the data set.
- Tally the frequency in each class.
expand button
Transcribed Image Text:Time per Week on Meetings
21
23
14
15
19
18
15
15
23
18
23
16
21
15
13
20
19
20
22
21
12
18
19
23
15
Expert Solution
Check MarkThis question has been solved!
Explore an expertly crafted, step-by-step solution for a thorough understanding of key concepts.
bartleby
This is a popular solution
bartleby
Trending nowThis is a popular solution!
bartleby
Step by stepSolved in 2 steps with 5 images
Knowledge Booster
Background pattern image
Similar questions
- Find the 5 number summary for the data shown. 1 11 25 29 45 50 60 70 73 84 94 97 100 5 number summary:arrow_forwardThe variable height that is measured into short and tall groups is considered a variable. qualitative continuous survey quantitativearrow_forwardA local, family-owned restaurant also gathered data for two weeks of orders. The following set of data represents the number of orders filled by this restaurant during a two week period. Construct a five number summary for the the data. 82, 81, 65, 62, 86, 81, 83, 62, 81, 81, 68, 71, 85, 62, 87 (Round to the nearest hundredth, if needed). Min _______________________ Lower Quartile _______________________ Median ________________________ Upper Quartile _________________________ Maximum __________________________ What is the range and interquartile range for the family-owned restaurant? Range ___________________________ Interquartile Range ____________________________ Considering this data only, did the national-chain restaurant or the family-owned restaurant do better for the past two weeks? _______________________________________arrow_forward
- For which of the following sets of data should a stacked bar chart be used? The average height of men vs. the average height of women The number of red cars vs. the number of red bicycles The total number of movies watched categorized by science fiction vs. non-science fiction The average age of surfers vs. the average age of scuba diversarrow_forwardPlease do this in excel and show me how to do it. Need helparrow_forwardSuppose a data set ranges from a low value of 29 and a high value of 62. Calculate the class width for a frequency table with 6 classes.arrow_forward
- After giving a statistics exam, professor Dang determined the following five-number summary for her class results: 60 68 77 89 98. Use this information to draw a box plot of the exam scoresarrow_forwardRichard’s doctor had told him he needed to keep track of his blood sugar readings. Listed below are his 20 latest readings. He wanted to create a visual aid for himself in order to see how his blood sugar was doing. 75 125 110 82 178 209 150 130 120 142 90 98 107 163 135 129 147 152 110 100 A. Create a frequency distribution table for the given data set. B. Create a histogram for the data set. C. Describe the distribution of the data.arrow_forward4. Use this data from the HANES5 survey to estimate the average weight of men 18 and over whose heights were 73 inches. average height: 69 inches average weight: 190 pounds r = 0.41 SD 3 inches SD 42 poundsarrow_forward
- What is the difference between relative frequency and cumulative frequency? Choose the correct answer below. A. Relative frequency of a class is the number of observations in that class, while cumulative frequency of a class is the sum of all the frequencies. B. Relative frequency of a class is the proportion of the data in that class, while cumulative frequency of a class is the number of observations in that class. C. Relative frequency of a class is the percentage of the data that falls in that class, while cumulative frequency of a class is the sum of the frequencies of that class and all previous classes. O D. There is no difference between the two.arrow_forwardFind the 5 number summary for the data shown 3 34 38 41 43 66 70 71 81 83 100 5 number summary:arrow_forwardUse the Histogram tool to develop a frequency distribution and histogram for the number of months as a customer of the bank in the data below. Compute the relative and cumulative relative frequencies and use a line chart to construct an ogive. Complete the frequency distribution for the months as a customer, and compute the relative and cumulative relative frequencies. (Type integers or decimals rounded to three decimal places as needed.) Bins Frequency Relative Frequency Cumulative Relative Frequency 10 enter your response here enter your response here enter your response here 20 enter your response here enter your response here enter your response here 30 enter your response here enter your response here enter your response here 40 enter your response here enter your response here enter your response here 50 enter your response here enter your response here enter your...arrow_forward
arrow_back_ios
SEE MORE QUESTIONS
arrow_forward_ios
Recommended textbooks for you
- Text book imageMATLAB: An Introduction with ApplicationsStatisticsISBN:9781119256830Author:Amos GilatPublisher:John Wiley & Sons IncText book imageProbability and Statistics for Engineering and th...StatisticsISBN:9781305251809Author:Jay L. DevorePublisher:Cengage LearningText book imageStatistics for The Behavioral Sciences (MindTap C...StatisticsISBN:9781305504912Author:Frederick J Gravetter, Larry B. WallnauPublisher:Cengage Learning
- Text book imageElementary Statistics: Picturing the World (7th E...StatisticsISBN:9780134683416Author:Ron Larson, Betsy FarberPublisher:PEARSONText book imageThe Basic Practice of StatisticsStatisticsISBN:9781319042578Author:David S. Moore, William I. Notz, Michael A. FlignerPublisher:W. H. FreemanText book imageIntroduction to the Practice of StatisticsStatisticsISBN:9781319013387Author:David S. Moore, George P. McCabe, Bruce A. CraigPublisher:W. H. Freeman
Text book image
MATLAB: An Introduction with Applications
Statistics
ISBN:9781119256830
Author:Amos Gilat
Publisher:John Wiley & Sons Inc
Text book image
Probability and Statistics for Engineering and th...
Statistics
ISBN:9781305251809
Author:Jay L. Devore
Publisher:Cengage Learning
Text book image
Statistics for The Behavioral Sciences (MindTap C...
Statistics
ISBN:9781305504912
Author:Frederick J Gravetter, Larry B. Wallnau
Publisher:Cengage Learning
Text book image
Elementary Statistics: Picturing the World (7th E...
Statistics
ISBN:9780134683416
Author:Ron Larson, Betsy Farber
Publisher:PEARSON
Text book image
The Basic Practice of Statistics
Statistics
ISBN:9781319042578
Author:David S. Moore, William I. Notz, Michael A. Fligner
Publisher:W. H. Freeman
Text book image
Introduction to the Practice of Statistics
Statistics
ISBN:9781319013387
Author:David S. Moore, George P. McCabe, Bruce A. Craig
Publisher:W. H. Freeman