MATLAB: An Introduction with Applications
MATLAB: An Introduction with Applications
6th Edition
ISBN: 9781119256830
Author: Amos Gilat
Publisher: John Wiley & Sons Inc
expand_more
expand_more
format_list_bulleted
Bartleby Related Questions Icon
Related questions
bartleby
Concept explainers
Question
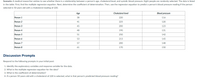
Transcribed Image Text:Scenario: A medical researcher wishes to see whether there is a relationship between a person's age, cholesterol level, and systolic blood pressure. Eight people are randomly selected. The data is listed
in the table. First, find the multiple regression equation. Next, determine the coefficient of determination. Then, use the regression equation to predict a person's blood pressure reading if the person
selected is 50 years old with a cholesterol reading of 220.
Age
Cholesterol level
Blood pressure
Person 1
38
220
116
Person 2
41
225
120
Person 3
45
200
123
Person 4
48
190
131
Person 5
51
250
142
Person 6
53
215
145
Person 7
57
200
148
Person 8
61
170
150
Discussion Prompts
Respond to the following prompts in your initial post:
1. Identify the explanatory variables and response variable for the data.
2. What is the multiple regression equation for the data?
3. What is the coefficient of determination?
4. If a person 50 years old with a cholesterol of 220 is selected, what is that person's predicted blood pressure reading?
Expert Solution
Check MarkThis question has been solved!
Explore an expertly crafted, step-by-step solution for a thorough understanding of key concepts.
bartleby
This is a popular solution
bartleby
Trending nowThis is a popular solution!
bartleby
Step by stepSolved in 4 steps
Knowledge Booster
Background pattern image
Learn more about
Need a deep-dive on the concept behind this application? Look no further. Learn more about this topic, statistics and related others by exploring similar questions and additional content below.Similar questions
- Please anwser using SPSS!arrow_forward12. A consumer advocacy group recorded several variables on 140 models of cars. The resulting information was used to produce the following regression output that relates the city gas mileage (in mpg) and the engine displacement (in cubic inches). The regression equation is mpg:city= 33.4 0.0624 displacement Predictor Constant SE Coef T P 0.7762 43.00 0.000 displacement -0.0624 0.003810 0.000 S 3.13923 = R-Sq 66.0% R-Sq (adj) = 65.8% a. We have a car that has an engine with 150 cubic inches. Based on this output, what city gas mileage would you predict for this car? Coef 33.4 b. Based on this output what is the correlation between city gas mileage and displacement? C. I value: The test statistics for testing the slope is zero is missing. Calculate this The group o also recorded the power of the engine (in horsepower) for each car. The following regression output was produced. Predictor Constant horsepower The regression equation is mpg:city = 32.2 0.0572 horsepower Coef SE Coef 32.2 T...arrow_forward. A professor at the University of Alabama was interested in evaluating the relationship between family support and delinquency. Using data collected on 4545 families, the researcher used regression to analyze the relationship. The results are presented below. Variables Entered/Removeda Model Variables Entered Variables Removed Method 1 Family supportb . Enter a. Dependent Variable: Delinquency b. All requested variables entered. Model Summary Model R R Square Adjusted R Square Std. Error of the Estimate 1 .249a .062 .062 1.59168 a. Predictors: (Constant), Family support ANOVAa Model Sum of Squares df Mean Square F Sig. 1 Regression 759.204 1 759.204 299.671 <.001b Residual 11479.107 4531 2.533 Total 12238.311 4532 a. Dependent Variable: Delinquency b. Predictors: (Constant), Family support...arrow_forward
- Please answer these questions carefully to get the correct answers for my Statistics homework problems.arrow_forwardAnswer all questionsarrow_forwardListed.below are systolic blood pressure measurements (in mm Hg) obtained from the same woman. Find the regression equation, letting the right arm blood pressure be the predictor (x) variable. Find the best predicted systolic blood pressure in the left arm given that the systolic blood pressure in the right arm is 1000 mm Hg. Use a significance level of 0.05. Right Arm 102 101 94 79 79 O Left Arm 175 168 146 147 145 Click the icon to view the critical values of the Pearson correlation coefficient r The regression equation is y= X. (Round to one decimal place as needed.)arrow_forward
- Consider the following data: x ̄ = 20, sx = 2, y ̄ = −5, sy = 4, and b1 = 0.40. Which of the following is the sample regression equation?arrow_forwardI need help with these questions. I did part A with the regressional analysis and got 92.5% for the coefficient determination.arrow_forwardThe table below gives the age and bone density for five randomly selected women. Using this data, consider the equation of the regression line, y = bo + bjx, for predicting a woman's bone density based on her age. Keep in mind, the correlation coefficient may or may not be statistically significant for the data given. Remember, in practice, it would not be appropriate to use the regression line to make a prediction if the correlation coefficient is not statistically significant. Age 47 49 50 51 58 Bone Density 360 353 336 333 310 Table Copy Data Step 1 of 6: Find the estimated slope. Round your answer to three decimal places.arrow_forward
- Help with the problemarrow_forwardI need help finding the answers for A,B,and Carrow_forwardThe Cadet is a popular model of sport utility vehicle, known for its relatively high resale value. The bivariate data given below were taken from a sample of sixteen Cadets, each bought new two years ago, and each sold used within the past month. For each Cadet in the sample, we have listed both the mileage x (in thousands of miles) that the Cadet had on its odometer at the time it was sold used and the price y (in thousands of dollars) at which the Cadet was sold used. With the aim of predicting the used selling price from the number of miles driven, we might examine the least-squares regression line, y=41.57 – 0.49.x. This line is shown in the scatter plot in Figure 1. Used selling price, Mileage, x (in thousands) (in thousands of dollars) 25.9 26.1 28.1 26.2 40- 21.1 31.4 24.0 27.5 35 27.2 30.9 38.7 21.4 30. 34.6 25.5 37.2 23.5 15.6 34.0 25- 23.8 28.0 20.9 30.9 20. 23.1 32.7 28.0 30.3 40 29.2 28.1 Figure 1 24.0 29.6 23.0 31.5 Send data to Excelarrow_forward
arrow_back_ios
SEE MORE QUESTIONS
arrow_forward_ios
Recommended textbooks for you
- Text book imageMATLAB: An Introduction with ApplicationsStatisticsISBN:9781119256830Author:Amos GilatPublisher:John Wiley & Sons IncText book imageProbability and Statistics for Engineering and th...StatisticsISBN:9781305251809Author:Jay L. DevorePublisher:Cengage LearningText book imageStatistics for The Behavioral Sciences (MindTap C...StatisticsISBN:9781305504912Author:Frederick J Gravetter, Larry B. WallnauPublisher:Cengage Learning
- Text book imageElementary Statistics: Picturing the World (7th E...StatisticsISBN:9780134683416Author:Ron Larson, Betsy FarberPublisher:PEARSONText book imageThe Basic Practice of StatisticsStatisticsISBN:9781319042578Author:David S. Moore, William I. Notz, Michael A. FlignerPublisher:W. H. FreemanText book imageIntroduction to the Practice of StatisticsStatisticsISBN:9781319013387Author:David S. Moore, George P. McCabe, Bruce A. CraigPublisher:W. H. Freeman
Text book image
MATLAB: An Introduction with Applications
Statistics
ISBN:9781119256830
Author:Amos Gilat
Publisher:John Wiley & Sons Inc
Text book image
Probability and Statistics for Engineering and th...
Statistics
ISBN:9781305251809
Author:Jay L. Devore
Publisher:Cengage Learning
Text book image
Statistics for The Behavioral Sciences (MindTap C...
Statistics
ISBN:9781305504912
Author:Frederick J Gravetter, Larry B. Wallnau
Publisher:Cengage Learning
Text book image
Elementary Statistics: Picturing the World (7th E...
Statistics
ISBN:9780134683416
Author:Ron Larson, Betsy Farber
Publisher:PEARSON
Text book image
The Basic Practice of Statistics
Statistics
ISBN:9781319042578
Author:David S. Moore, William I. Notz, Michael A. Fligner
Publisher:W. H. Freeman
Text book image
Introduction to the Practice of Statistics
Statistics
ISBN:9781319013387
Author:David S. Moore, George P. McCabe, Bruce A. Craig
Publisher:W. H. Freeman