MATLAB: An Introduction with Applications
MATLAB: An Introduction with Applications
6th Edition
ISBN: 9781119256830
Author: Amos Gilat
Publisher: John Wiley & Sons Inc
expand_more
expand_more
format_list_bulleted
Bartleby Related Questions Icon
Related questions
Question
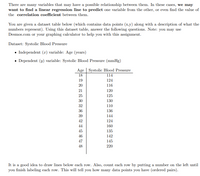
Transcribed Image Text:There are many variables that may have a possible relationship between them. In these cases, we may
want to find a linear regression line to predict one variable from the other, or even find the value of
the correlation coefficient between them.
You are given a dataset table below (which contains data points (x,y) along with a description of what the
numbers represent). Using this dataset table, answer the following questions. Note: you may use
Desmos.com or your graphing calculator to help you with this assignment.
Dataset: Systolic Blood Pressure
• Independent (x) variable: Age (years)
• Dependent (y) variable: Systolic Blood Pressure (mmHg)
Age | Systolic Blood Pressure
114
18
19
124
20
116
21
120
25
125
30
130
32
110
36
136
39
144
42
124
44
160
45
135
46
142
47
145
48
220
It is a good idea to draw lines below each row. Also, count each row by putting a number on the left until
you finish labeling each row. This will tell you how many data points you have (ordered pairs).
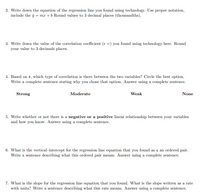
Transcribed Image Text:2. Write down the equation of the regression line you found using technology. Use proper notation,
include the ŷ = mx + b Round values to 3 decimal places (thousandths).
3. Write down the value of the correlation coefficient (r =) you found using technology here. Round
your value to 3 decimals places.
4. Based on r, which type of correlation is there between the two variables? Circle the best option.
Write a complete sentence stating why you chose that option. Answer using a complete sentence.
Strong
Moderate
Weak
None
5. Write whether or not there is a negative or a positive linear relationship between your variables
and how you know. Answer using a complete sentence.
6. What is the vertical-intercept for the regression line equation that you found as a an ordered pair.
Write a sentence describing what this ordered pair means. Answer using a complete sentence.
7. What is the slope for the regression line equation that you found. What is the slope written as a rate
with units? Write a sentence describing what this rate means. Answer using a complete sentence.
Expert Solution
Check MarkThis question has been solved!
Explore an expertly crafted, step-by-step solution for a thorough understanding of key concepts.
bartleby
This is a popular solution
bartleby
Trending nowThis is a popular solution!
bartleby
Step by stepSolved in 3 steps
Knowledge Booster
Background pattern image
Similar questions
- The arm span and foot length were both measured (in centimeters) for each of 20 students in a biology class. The computer output displays the regression analysis. Which of the following is the best interpretation of the coefficient of determination r2? About 37% of the variation in arm span is accounted for by the linear relationship formed with the foot length. About 65% of the variation in foot length is accounted for by the linear relationship formed with the arm span. About 63% of the variation in arm span is accounted for by the linear relationship formed with the foot length. About 63% of the variation in foot length is accounted for by the linear relationship formed with the arm span.arrow_forwardYou generate a scatter plot using Excel. You then have Excel plot the trend line and report the equation and the 2 value. The regression equation is reported as y = 49.18x + 40.52 and the r2 = 0.5041. What is the correlation coefficient for this data set? r =arrow_forwardPlease help with these questions.arrow_forward
- Please see question details in attached picture.arrow_forwardUse the following to answer the question: ˆy=−4x+10.3 with R2=35%. Which best describes the correlation? Weak negative linear relationship Weak positive linear relationship Moderate negative linear relationship No linear relationship Moderate positive linear relationshiparrow_forwardUse the value of the linear correlation coefficient to calculate the coefficient of determination. What does this tell you about the explained variation of the data about the regression line? About the unexplained variation? r= -0.438 please dont copy paste the content from other sitesarrow_forward
- Using your favorite statistics software package, you generate a scatter plot with a regression equation and correlation coefficient. The regression equation is reported asy=43.25x+19.44y=43.25x+19.44and the r=0.98r=0.98.What proportion of the variation in y can be explained by the variation in the values of x?r2 = %arrow_forwardhelparrow_forwardHello there, please help me with this problem and thank you!arrow_forward
arrow_back_ios
arrow_forward_ios
Recommended textbooks for you
- Text book imageMATLAB: An Introduction with ApplicationsStatisticsISBN:9781119256830Author:Amos GilatPublisher:John Wiley & Sons IncText book imageProbability and Statistics for Engineering and th...StatisticsISBN:9781305251809Author:Jay L. DevorePublisher:Cengage LearningText book imageStatistics for The Behavioral Sciences (MindTap C...StatisticsISBN:9781305504912Author:Frederick J Gravetter, Larry B. WallnauPublisher:Cengage Learning
- Text book imageElementary Statistics: Picturing the World (7th E...StatisticsISBN:9780134683416Author:Ron Larson, Betsy FarberPublisher:PEARSONText book imageThe Basic Practice of StatisticsStatisticsISBN:9781319042578Author:David S. Moore, William I. Notz, Michael A. FlignerPublisher:W. H. FreemanText book imageIntroduction to the Practice of StatisticsStatisticsISBN:9781319013387Author:David S. Moore, George P. McCabe, Bruce A. CraigPublisher:W. H. Freeman
Text book image
MATLAB: An Introduction with Applications
Statistics
ISBN:9781119256830
Author:Amos Gilat
Publisher:John Wiley & Sons Inc
Text book image
Probability and Statistics for Engineering and th...
Statistics
ISBN:9781305251809
Author:Jay L. Devore
Publisher:Cengage Learning
Text book image
Statistics for The Behavioral Sciences (MindTap C...
Statistics
ISBN:9781305504912
Author:Frederick J Gravetter, Larry B. Wallnau
Publisher:Cengage Learning
Text book image
Elementary Statistics: Picturing the World (7th E...
Statistics
ISBN:9780134683416
Author:Ron Larson, Betsy Farber
Publisher:PEARSON
Text book image
The Basic Practice of Statistics
Statistics
ISBN:9781319042578
Author:David S. Moore, William I. Notz, Michael A. Fligner
Publisher:W. H. Freeman
Text book image
Introduction to the Practice of Statistics
Statistics
ISBN:9781319013387
Author:David S. Moore, George P. McCabe, Bruce A. Craig
Publisher:W. H. Freeman