Steel Design (Activate Learning with these NEW titles from Engineering!)
Steel Design (Activate Learning with these NEW titles from Engineering!)
6th Edition
ISBN: 9781337094740
Author: Segui, William T.
Publisher: Cengage Learning
expand_more
expand_more
format_list_bulleted
Bartleby Related Questions Icon
Related questions
Question
The problem is attached below. Please look at the attached picture and show the steps of the solution.
Transcribed Image Text:(2) Estimate the required increase in the reinforcement ratio, p, to increase the reliability index to
ẞFORM = 3.
(3) Estimate the change in FORM if the coefficient of variation of f, is increased to 0.15, while its
mean is kept fixed.
(4) What are the 8 and
sensitivity vectors (see p. 215 of Course Reader). Rank the importance of
the basic random variables in terms of the relative sensitivity of BFORM or PR, to their uncertainty
(measured by their standard deviation).
II. Using the sensitivity measures with respect to the mean and standard deviation of random variable f
obtained from FERUM, derive the sensitivity of ẞ and p with respect to the parameters A and
λ
of random variable f. Check your solutions with those obtained from FERUM.
III. Using the general-purpose reliability analysis program FERUM, determine the SORM estimates (both
using "curvature fitting" and "point fitting") of the reliability index ẞ and failure probability Pr
compare them with the corresponding FORM results and comment.
IV. Using the general-purpose reliability analysis program FERUM, estimate the failure probability using
Monte Carlo simulation. Specify NMCs = 500,000 realizations and a target sample coefficient of
variation (cov) of the estimate of the failure probability of 5 percent. The Monte Carlo simulation stops
after NMCs realizations or after the sample coefficient of variation falls below the target value cov,
whichever arrives first. Compare the Monte Carlo Simulation estimate of the failure probability with
the FORM and SORM estimates obtained in parts I and III, respectively, and comment.
V. Repeat Part I assuming a statistical correlation coefficient between random variables b and d of 0.80
and compare the FORM estimates of the reliability index and failure probability with those obtained
under Part I.
Provide your FERUM input file with your solution.
>
![画像:In the reliability analysis of a reinforced concrete beam under bending, the limit-state function is defined as M where p = 0.02 is the reinforcement ratio and the remaining variables are uncertain with the following statistical description: Random Variable Distribution Mean Coefficient of Variation b [in] beam width normal 10 0.05 d [in]: depth to reinforcement normal 18 0.10 f, [ksi]: yield stress of steel f[ksi] compressive strength of concrete lognormal 47 0.12 lognormal 3.5 0.20 77 [-] shape factor for stress block diagram uniform 0.60 0.05 M [k-in]: applied bending moment Type I, Largest Value (Gumbel) 1000 0.20 Assume the above random variables to be mutually statistically independent. I. Using the general-purpose reliability analysis program FERUM, determine the FORM estimate of the reliability index and failure probability P, the coordinates of the most likely failure point, u and x", and the sensitivity measures with respect to the mean and standard deviation of each random variable. Use these results to make the following estimates by hand calculation: (1) Estimate the changes in FORM and PR if the mean of M is increased to 1100 [k-in].](https://content.bartleby.com/qna-images/question/41633170-d1cd-4c8b-a82b-0acddcbfc65d/b325ba6d-3984-4e00-9717-2b5bd849c0a6/la97w3f_thumbnail.jpeg)
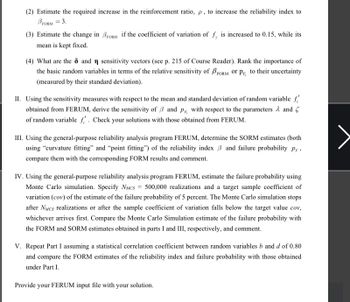
Transcribed Image Text:In the reliability analysis of a reinforced concrete beam under bending, the limit-state function is defined
as
M
where p = 0.02 is the reinforcement ratio and the remaining variables are uncertain with the following
statistical description:
Random Variable
Distribution
Mean
Coefficient of Variation
b [in] beam width
normal
10
0.05
d [in]: depth to reinforcement
normal
18
0.10
f, [ksi]: yield stress of steel
f[ksi] compressive strength
of concrete
lognormal
47
0.12
lognormal
3.5
0.20
77 [-] shape factor for stress
block diagram
uniform
0.60
0.05
M [k-in]: applied bending
moment
Type I, Largest
Value (Gumbel)
1000
0.20
Assume the above random variables to be mutually statistically independent.
I. Using the general-purpose reliability analysis program FERUM, determine the FORM estimate of the
reliability index and failure probability P, the coordinates of the most likely failure point,
u and x", and the sensitivity measures with respect to the mean and standard deviation of each random
variable. Use these results to make the following estimates by hand calculation:
(1) Estimate the changes in FORM and PR if the mean of M is increased to 1100 [k-in].
Expert Solution
Check MarkThis question has been solved!
Explore an expertly crafted, step-by-step solution for a thorough understanding of key concepts.
bartleby
Step by stepSolved in 2 steps with 2 images
Knowledge Booster
Background pattern image
Recommended textbooks for you
- Text book imageSteel Design (Activate Learning with these NEW ti...Civil EngineeringISBN:9781337094740Author:Segui, William T.Publisher:Cengage LearningText book imageConstruction Materials, Methods and Techniques (M...Civil EngineeringISBN:9781305086272Author:William P. Spence, Eva KultermannPublisher:Cengage LearningText book imageTraffic and Highway EngineeringCivil EngineeringISBN:9781305156241Author:Garber, Nicholas J.Publisher:Cengage Learning
- Text book imageMaterials Science And Engineering PropertiesCivil EngineeringISBN:9781111988609Author:Charles GilmorePublisher:Cengage LearningText book imageEngineering Fundamentals: An Introduction to Engi...Civil EngineeringISBN:9781305084766Author:Saeed MoaveniPublisher:Cengage LearningText book imagePrinciples of Foundation Engineering (MindTap Cou...Civil EngineeringISBN:9781305081550Author:Braja M. DasPublisher:Cengage Learning
Text book image
Steel Design (Activate Learning with these NEW ti...
Civil Engineering
ISBN:9781337094740
Author:Segui, William T.
Publisher:Cengage Learning
Text book image
Construction Materials, Methods and Techniques (M...
Civil Engineering
ISBN:9781305086272
Author:William P. Spence, Eva Kultermann
Publisher:Cengage Learning
Text book image
Traffic and Highway Engineering
Civil Engineering
ISBN:9781305156241
Author:Garber, Nicholas J.
Publisher:Cengage Learning
Text book image
Materials Science And Engineering Properties
Civil Engineering
ISBN:9781111988609
Author:Charles Gilmore
Publisher:Cengage Learning
Text book image
Engineering Fundamentals: An Introduction to Engi...
Civil Engineering
ISBN:9781305084766
Author:Saeed Moaveni
Publisher:Cengage Learning
Text book image
Principles of Foundation Engineering (MindTap Cou...
Civil Engineering
ISBN:9781305081550
Author:Braja M. Das
Publisher:Cengage Learning