MATLAB: An Introduction with Applications
MATLAB: An Introduction with Applications
6th Edition
ISBN: 9781119256830
Author: Amos Gilat
Publisher: John Wiley & Sons Inc
expand_more
expand_more
format_list_bulleted
Bartleby Related Questions Icon
Related questions
Question
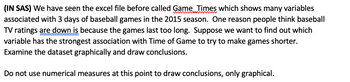
Transcribed Image Text:(IN SAS) We have seen the excel file before called Game Times which shows many variables
associated with 3 days of baseball games in the 2015 season. One reason people think baseball
TV ratings are down is because the games last too long. Suppose we want to find out which
variable has the strongest association with Time of Game to try to make games shorter.
Examine the dataset graphically and draw conclusions.
Do not use numerical measures at this point to draw conclusions, only graphical.
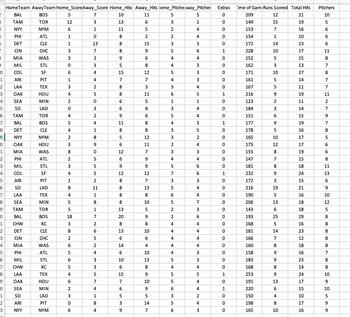
Transcribed Image Text:HomeTeam Away Team Home_ScoreAway_Score Home_Hits Away_Hits lome_Pitchelway_Pitcher
Extras
ime of Gam Runs Scored Total Hits
Pitchers
2
BAL
BOS
3
TAM
TOR
52
12
NYY
NYM
6
5
PHI
ATL
1
731C
10
13
11
0
8
1652
11
5
5
0
209
3
2
0
149
2
4
0
153
2
4
0
154
5
DET
CLE
1
13
7
CIN
CHC
3
7
B
MIA
WAS
3
2
888
15
3
3
0
172
9
5
6
1
228
9
6
4
4
0
152
9
MIL
STL
0
3
5
8
4
3
0
162
0
COL
SF
6
4
15
12
5
3
0
171
1
ARI
PIT
1
2
LAA
TEX
3
3
OAK
HOU
4
425
7
7
4
3
0
161
8
3
3
4
0
167
23712253255
21
19
16
10
14
23
10
17
256667
10
11
15
8
13
7
10
27
8
14
7
11
7
8
11
6
5
1
216
9
19
11
4
SEA
MIN
2
0
6
5
1
1
0
123
2
11
2
5
SD
LAD
0
6
TAM
TOR
4
7
BAL
BOS
5
8
DET
CLE
4
9
NYY
NYM
2
0
OAK
HOU
3
1
ΜΙΑ
WAS
8
2
PHI
ATL
2
5
324
8562
1890S
6
8
3
4
0
184
3
14
7
9
6
5
4
0
151
6
15
9
11
8
4
3
1
177
9
19
7
8
3
5
0
178
5
16
12
217
3
2
0
165
10
17
11
2
4
0
175
12
17
3
3
0
155
8
19
6
9
4
4
0
147
7
15
3
MIL
STL
3
4
COL
SF
4
5
ARI
PIT
1
6
SD
LAD
8
7
LAA
TEX
4
8
SEA
MIN
5
9
TAM
TOR
5
0
BAL
BOS
18
5521% 1N
9
12
12
8
11
8
8
8
8
927385
5
6
0
181
8
18
7
6
1
232
9
24
8566822
11
13
3
3
0
172
3
15
6
13
5
4
0
216
6
4
0
190
10
5
7
0
206
13
2
3
0
143
9536
19
21
9
16
10
13
18
12
18
5
7
20
1
CHW
KC
3
2
DET
CLE
8
3
CIN
CHC
2
4
ΜΙΑ
WAS
6
5
PHI
ATL
5
6
MIL
STL
6
7
CHW
KC
5
8
LAA
TEX
4
9
OAK
HOU
0
SEA
MIN
1
SD
LAD
2
ARI
PIT
3
NYY
NYM
2652433574184
8
13
6
9826
2
6
0
193
25
29
8
4
4
0
168
5
16
8
10
4
4
0
181
14
23
8
4
4
0
166
7
12
8
14
4
4
4
0
160
8
18
8
6
10
4
3
0
158
9
16
7
10
13
6
8
300
5
3
0
183
9
23
8
4
4
0
168
8
14
8
596539
62306
15
9
5
5
1
253
9
24
10
7
10
5
4
0
191
13
17
9
9
6
4
1
220
5
3
2
0
150
14
5
4
0
198
7
6
3
0
165
6489
15
10
10
5
17
9
10
16
9
Expert Solution
Check MarkThis question has been solved!
Explore an expertly crafted, step-by-step solution for a thorough understanding of key concepts.
bartleby
Step by stepSolved in 2 steps
Knowledge Booster
Background pattern image
Similar questions
- Use the estimate yest=3.3x2 - 9.4x - 0.1 to calculate a set of residuals, using a formula or a calculator. Explain your steps, then create a residual plot using this new model and assess its validityarrow_forwardwhen a regression is used as a method of predicting dependent variables from one or more independent variables. How are the independent variables different from each other yet related to the dependent variable?arrow_forwardDescribe the correlation coefficient and explain how it is used in regression analysis?arrow_forward
- Describe how correlation and regression are linked yet distinct.arrow_forwardplease use this situation: A small theater company has a linear regression model to estimate y = the concession stand sales in dollars, based on knowing x = the number of people in attendance. The regression equation is: = 6.72x + 11.50 and the correlation coefficient was r = 0.781. The data set saw the number of people in attendance ranging from a minimum of 18 people to a maximum of 170 people. 1) How reliable would it be to make a prediction for the concession sales amount if there were 500 people in attendance? Explain.arrow_forwardA researcher is studying the intensity of hurricanes that entered the Gulf of Mexico between 1975-2015 and the average water temperature of the Gulf of Mexico at the hurricane's peak strength. What is the independent and dependent variable in this study?arrow_forward
- A researcher gives a depression scale to 300 people now, 6 weeks later, and 6 months later. She finds that the depression scale means are relatively the same over those three time periods. Does this mean that the depression scale is valid, and/or reliable? Explain.arrow_forwardElaine is interested in determining if men are more satisfied in their jobs than women in the healthcare industry. She administers a job satisfaction questionnaire to 20 men and 20 women working in hospital administration. Her grouping variable is gender and dependent variable is job satisfaction. The job satisfaction scale consists of 8 items measured using a 5-point rating scale. A higher score on this scale would indicate high job satisfaction. The maximum score that can be obtained on the scale is 40. We can assume that job satisfaction scores are normally distributed. Use the appropriate T test with a significance level of 0.05 to test the hypothesis. Research Question Do the mean job satisfaction scores differ for men and women working in the hospital administration department? Hypothesis The mean job satisfaction scores do not differ for men and women working in the hospital administration department. Compute an independent sample t test on these data. Report...arrow_forwardThe following regression equation is based on the analysis of four variables: SM_DOLLARS is the dollar amount of a watershed conservation agency's weekly spending on social media ads. RADIO_ADS is the number of radio advertisements aired weekly by the agency. WS_DOLLARS is the dollar amount of the agency’s weekly spending on web search ads. The variable WEB_VISITS is the number of weekly visitors to their educational website. These data have been recorded every week for the past three years. WEB_VISITS (expected) = 208 + 1.25*SM_DOLLARS + 1.5*RADIO_ADS + 1.2*WS_DOLLARS The data meet the assumptions for regression analysis, and the regression results, including the coefficients, were found to be statistically significant. Initially, 320ドル was spent on social media ads, 10 radio ads were aired, and 120ドル spent on web search ads. How many additional weekly web visits would you predict when the agency increases its weekly spending on social media ads by 440ドル without changing the...arrow_forward
arrow_back_ios
arrow_forward_ios
Recommended textbooks for you
- Text book imageMATLAB: An Introduction with ApplicationsStatisticsISBN:9781119256830Author:Amos GilatPublisher:John Wiley & Sons IncText book imageProbability and Statistics for Engineering and th...StatisticsISBN:9781305251809Author:Jay L. DevorePublisher:Cengage LearningText book imageStatistics for The Behavioral Sciences (MindTap C...StatisticsISBN:9781305504912Author:Frederick J Gravetter, Larry B. WallnauPublisher:Cengage Learning
- Text book imageElementary Statistics: Picturing the World (7th E...StatisticsISBN:9780134683416Author:Ron Larson, Betsy FarberPublisher:PEARSONText book imageThe Basic Practice of StatisticsStatisticsISBN:9781319042578Author:David S. Moore, William I. Notz, Michael A. FlignerPublisher:W. H. FreemanText book imageIntroduction to the Practice of StatisticsStatisticsISBN:9781319013387Author:David S. Moore, George P. McCabe, Bruce A. CraigPublisher:W. H. Freeman
Text book image
MATLAB: An Introduction with Applications
Statistics
ISBN:9781119256830
Author:Amos Gilat
Publisher:John Wiley & Sons Inc
Text book image
Probability and Statistics for Engineering and th...
Statistics
ISBN:9781305251809
Author:Jay L. Devore
Publisher:Cengage Learning
Text book image
Statistics for The Behavioral Sciences (MindTap C...
Statistics
ISBN:9781305504912
Author:Frederick J Gravetter, Larry B. Wallnau
Publisher:Cengage Learning
Text book image
Elementary Statistics: Picturing the World (7th E...
Statistics
ISBN:9780134683416
Author:Ron Larson, Betsy Farber
Publisher:PEARSON
Text book image
The Basic Practice of Statistics
Statistics
ISBN:9781319042578
Author:David S. Moore, William I. Notz, Michael A. Fligner
Publisher:W. H. Freeman
Text book image
Introduction to the Practice of Statistics
Statistics
ISBN:9781319013387
Author:David S. Moore, George P. McCabe, Bruce A. Craig
Publisher:W. H. Freeman