MATLAB: An Introduction with Applications
MATLAB: An Introduction with Applications
6th Edition
ISBN: 9781119256830
Author: Amos Gilat
Publisher: John Wiley & Sons Inc
expand_more
expand_more
format_list_bulleted
Bartleby Related Questions Icon
Related questions
Question
Look at the picture of the data set attached below or click this link to view the data set: https://docs.google.com/spreadsheets/d/1e0EJHxWj19KitPwekp2ncj7zhNOGjNRr5qJPfzZaosA/edit?usp=sharing
Then look at the
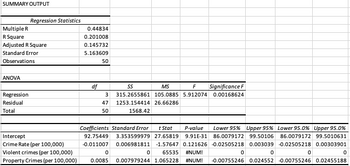
Transcribed Image Text:SUMMARY OUTPUT
Multiple R
R Square
Adjusted R Square
Standard Error
Observations
ANOVA
Regression Statistics
Regression
Residual
Total
Intercept
Crime Rate (per 100,000)
Violent crimes (per 100,000)
Property Crimes (per 100,000)
0.44834
0.201008
0.145732
5.163609
50
df
SS
MS
F
Significance F
3 315.2655861 105.0885 5.912074 0.00168624
47 1253.154414 26.66286
50
1568.42
Coefficients Standard Error t Stat P-value Lower 95% Upper 95% Lower 95.0% Upper 95.0%
92.75449 3.353599979 27.65819 9.91E-31 86.0079172 99.50106 86.0079172 99.5010631
-0.011007 0.006981811 -1.57647 0.121626 -0.02505218 0.003039 -0.02505218 0.00303901
65535 #NUM!
0.007979244 1.065228 #NUM! -0.00755246 0.024552 -0.00755246 0.02455188
0
0.0085
0
0
0
0
0
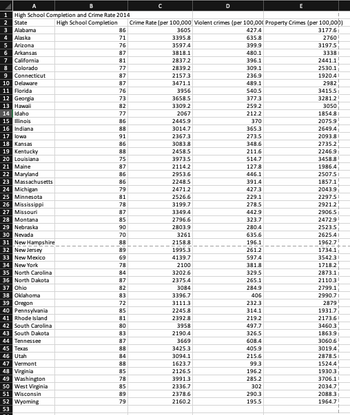
Transcribed Image Text:1 High School Completion and Crime Rate 2014
2 State
High School Completion
3 Alabama
4 Alaska
5 Arizona
6 Arkansas
7 California
8 Colorado
9 Connecticut
10 Delaware
11 Florida
12 Georgia
13 Hawaii
14 Idaho
15 Illinois
16 Indiana
17 lowa
18 Kansas
19 Kentucky
20 Louisiana
21 Maine
22 Maryland
23 Massachusetts
24 Michigan
25 Minnesota
26 Mississippi
27 Missouri
28 Montana
29 Nebraska
30 Nevada
31 New Hampshire
32 New Jersey
33 New Mexico
34 New York
35 North Carolina
36 North Dakota
37 Ohio
38 Oklahoma
39 Oregon
40 Pennsylvania
41 Rhode Island
42 South Carolina
43 South Dakota
44 Tennessee
45 Texas
46 Utah
47 Vermont
48 Virginia
49 Washington
50 West Virginia
51 Wisconsin
52 Wyoming
53
86
71
76
87
81
77
87
87
76
73
82
77
86
88
91
86
88
87
86
86
79
81
78
87
85
90
70
88
89
69
78
84
87
82
83
72
85
81
80
83
87
88
84
88
85
78
85
89
79
3395.8
3597.4
3818.1
2837.2
2839.2
2157.3
3471.1
3956
Crime Rate (per 100,000 Violent crimes (per 100,000 Property Crimes (per 100,000)
3605
427.A
3177.6
2760
3197.5
3658.5
3309.2
2067
2445.9
3014.7
2367.3
3083.8
2458.5
3973.5
2114.2
2953.6
2248.5
2471.2
2526.6
3199.7
3349.4
2796.6
2803.9
3261
2158.8
1995.3
4139.7
2100
3202.6
2375.4
3084
3396.7
3111.3
2245.8
2392.8
3958
2190.4
3669
3425.3
3094.1
1623.7
2126.5
3991.3
2336.7
D
2378.6
2160.2
635.8
399.9
480.1
396.1
309.1
236.9
489.1
540.5
377.3
259.2
212.2
370
365.3
273.5
348.6
211.6
4.7
127.8
446.1
391.4
427.3
229.1
278.5
442.9
323.7
280.4
635.6
196.1
261.2
597.4
381.8
329.5
265.1
284.9
406
E
232.3
314.1
219.2
497.7
326.5
608.4
405.9
215.6
99.3
196.2
285.2
302
290.3
195.5
3338
2441.1
2530.1
1920.4
2982
3415.5
3281.2
3050
1854.8
2075.9
2649.4
2093.8
2735.2
2246.9
3458.8
1986.4
2507.5
1857.1
2043.9
2297.5
2921.2
2906.5
2472.9
2523.5
2625.41
1962.7
1734.1
3542.3
1718.2
2873.1
2110.3
2799.1
2990.71
2879
1931.7
2173.61
3460.3
1863.9
3060.6
3019.4
2878.51
1524.4
1930.3
3706.1
2034.7
2088.3
1964.7
Expert Solution
Check MarkThis question has been solved!
Explore an expertly crafted, step-by-step solution for a thorough understanding of key concepts.
bartleby
This is a popular solution
bartleby
Trending nowThis is a popular solution!
bartleby
Step by stepSolved in 2 steps
Knowledge Booster
Background pattern image
Similar questions
- Refer to the data set:Part a: Make a scatter plot and determine which type of model best fits the data.Part b: Find the regression equation.Part c: Use the equation from Part b to determine y when x = 5.arrow_forwardDefine the different ways to use linear regression?arrow_forwardCan you please tell also the test statistics and if the weight is close to 518 pounds?arrow_forward
- The number of megapixels in a digital camera is one of the most important factors in determining picture quality. But, do digital cameras with more megapixels cost more? The following data show the number of megapixels and the price ($) for 10 digital cameras(Consumer Reports, March 2009). Use these data to develop an estimated regression equation that can be used to predict the price of a digital camera given the number of megapixels. Brand and Model Megapixels Price (S) Canon PowerShot SD1100 IS Casio Exilim Card EX-510 8 180 200 230 10 Sony Cyber-shot DSC-T70 Pentax Optio M50 Canon PowerShot G10 120 470 15 8 Canon PowerShot A590 IS Canon PowerShot El 140 180 10 12 Fujifilm FinePix FOOFD Sony Cyber-shot DSC-W170 Canon PowerShot A470 310 10 250 110arrow_forwardA linear regression equation has a slope of 4 and an intercept of 2. What is the predicted value of Y for an X of 8? Edit View Insert Format Tools Tablearrow_forwardCorvette, Ferrari, and Jaguar produced a variety of classic cars that continue to increase in value. The data showing the rarity rating (1–20) and the high price (1000ドルs) for 15 classic cars is contained in the Excel Online file below. Construct a spreadsheet to answer the following questions. Open spreadsheet Develop a scatter diagram of the data using the rarity rating as the independent variable and price as the dependent variable. Does a simple linear regression model appear to be appropriate? A simple linear regression model _________appearsdoes not appear to be appropriate. Develop an estimated multiple regression equation with rarity rating and as the two independent variables. (to whole numbers) What is the value of the coefficient of determination? Note: report between 0 and 1. (to 3 decimals) What is the value of the test statistic? (to 2 decimals) What is the -value? (to 4 decimals) Consider the nonlinear relationship shown by equation ....arrow_forward
- The applet displays a scatterplot with the following points: (7,10),(27,35),(24,25),(8,12),(10,19),(15,22). Identify the slope of the regression line, intercept of the regression line, and correlation coefficient. Report your answers accurate to within two decimal places.arrow_forwardRefer to the data set:(-1, 2), (1, 3), (1, 5), (2, 7), (3, 8), (4, 11)Part a: Make a scatter plot and determine which type of model best fits the data.Part b: Find the regression equation.Part c: Use the equation from Part b to determine y when x = 10arrow_forwardThe file Galton on D2L contains the 928 observations Francis Galton used in 1885 to estimate the relationship between the heights of parents and the heights of their children. The column Children refers to the height (in inches) of a child, and the column Mid-Parents refers to the average height (in inches) of the mother and father of that child. You can download this file into Excel and Minitab. a. Calculate the regression Height of Children = a +b (Height of Mid-Parents). b. Calculate the average for Height of Children, and calculate the average Height of Mid-Parents. c. Create a new variable in Minitab which is the Height of Children measured in terms of deviations from its mean. Call this new variable y. Also, create a new variable in Minitab with is the Height of Mid-Parents measured in terms of deviations from its mean. Call this new variable x. Calculate the regression y = a + bx. You can create the new y and x variables in Excel of Minitab, whichever you find more convenient....arrow_forward
arrow_back_ios
SEE MORE QUESTIONS
arrow_forward_ios
Recommended textbooks for you
- Text book imageMATLAB: An Introduction with ApplicationsStatisticsISBN:9781119256830Author:Amos GilatPublisher:John Wiley & Sons IncText book imageProbability and Statistics for Engineering and th...StatisticsISBN:9781305251809Author:Jay L. DevorePublisher:Cengage LearningText book imageStatistics for The Behavioral Sciences (MindTap C...StatisticsISBN:9781305504912Author:Frederick J Gravetter, Larry B. WallnauPublisher:Cengage Learning
- Text book imageElementary Statistics: Picturing the World (7th E...StatisticsISBN:9780134683416Author:Ron Larson, Betsy FarberPublisher:PEARSONText book imageThe Basic Practice of StatisticsStatisticsISBN:9781319042578Author:David S. Moore, William I. Notz, Michael A. FlignerPublisher:W. H. FreemanText book imageIntroduction to the Practice of StatisticsStatisticsISBN:9781319013387Author:David S. Moore, George P. McCabe, Bruce A. CraigPublisher:W. H. Freeman
Text book image
MATLAB: An Introduction with Applications
Statistics
ISBN:9781119256830
Author:Amos Gilat
Publisher:John Wiley & Sons Inc
Text book image
Probability and Statistics for Engineering and th...
Statistics
ISBN:9781305251809
Author:Jay L. Devore
Publisher:Cengage Learning
Text book image
Statistics for The Behavioral Sciences (MindTap C...
Statistics
ISBN:9781305504912
Author:Frederick J Gravetter, Larry B. Wallnau
Publisher:Cengage Learning
Text book image
Elementary Statistics: Picturing the World (7th E...
Statistics
ISBN:9780134683416
Author:Ron Larson, Betsy Farber
Publisher:PEARSON
Text book image
The Basic Practice of Statistics
Statistics
ISBN:9781319042578
Author:David S. Moore, William I. Notz, Michael A. Fligner
Publisher:W. H. Freeman
Text book image
Introduction to the Practice of Statistics
Statistics
ISBN:9781319013387
Author:David S. Moore, George P. McCabe, Bruce A. Craig
Publisher:W. H. Freeman