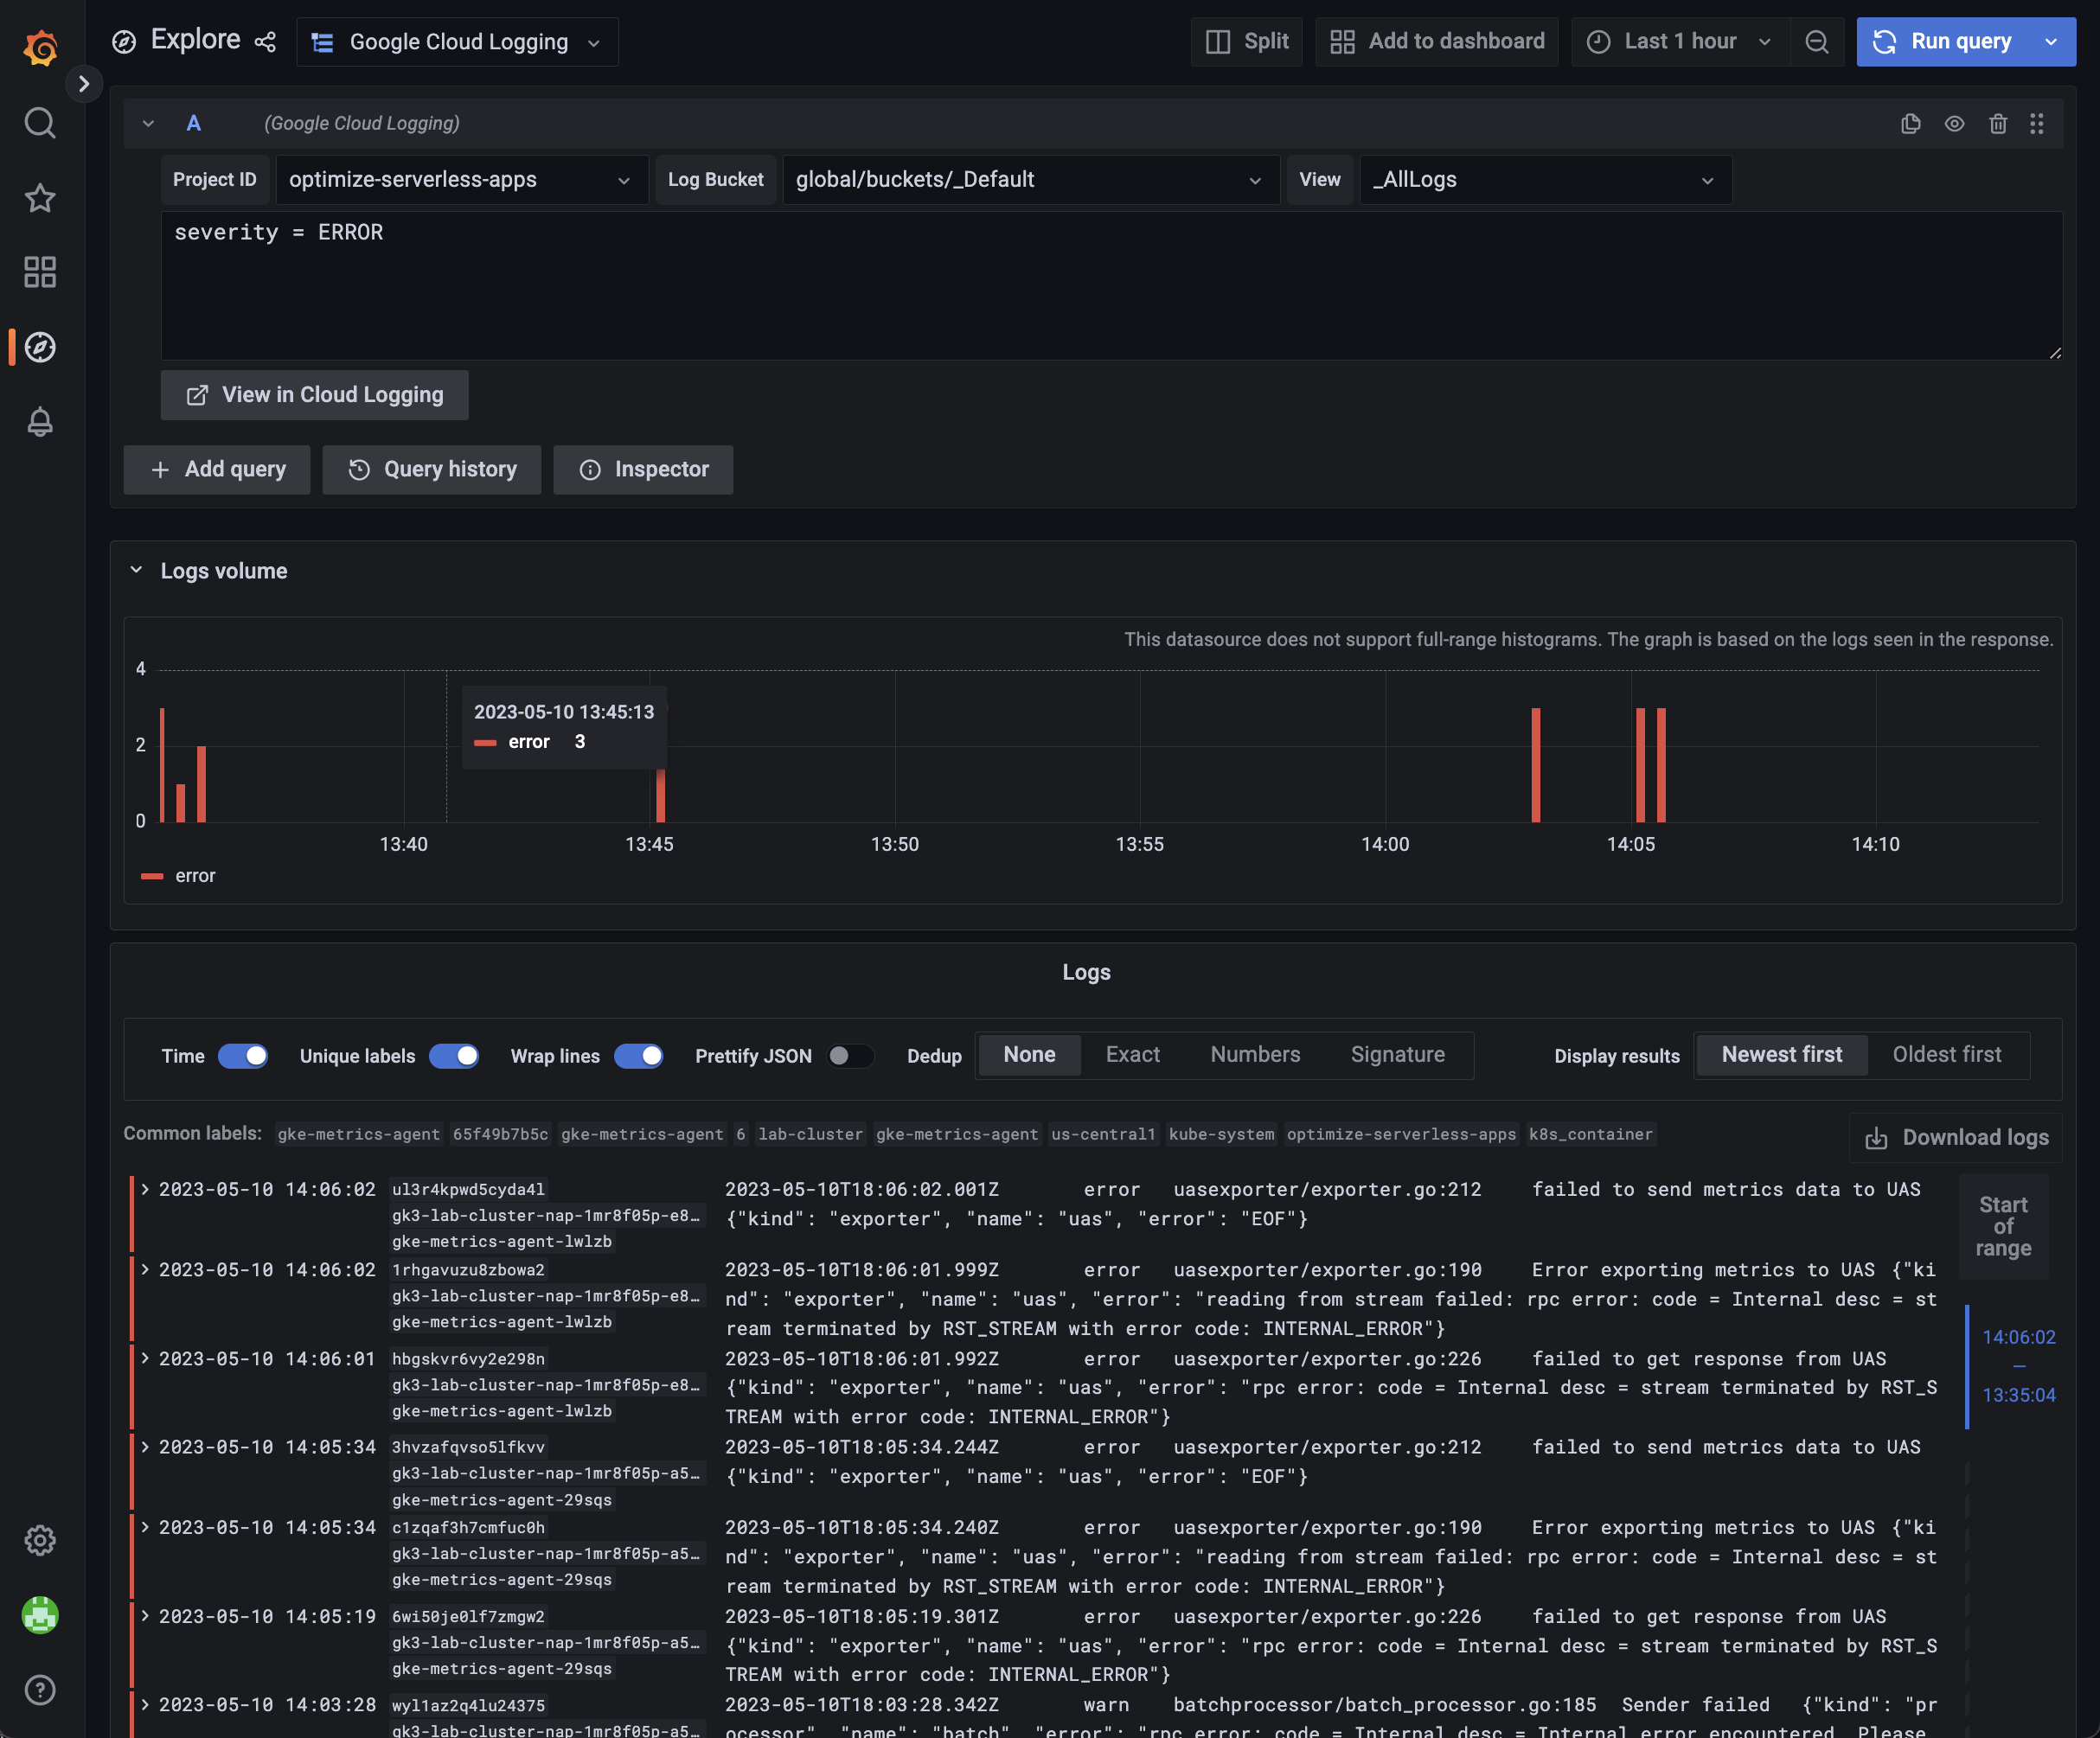
The Google Cloud Logging Data Source is a backend data source plugin for Grafana, which allows users to query and visualize their Google Cloud logs in Grafana.
You need to enable the resource manager API. Otherwise, your cloud projects will not be displayed in the dropdown menu.
You can follow the steps to enable it:
- Navigate to the cloud resource manager API page in GCP and select your project
- Press the
Enablebutton
- If you don't have a GCP project, add a new GCP project here
- Open the Credentials page in the Google API Console
- Click Create Credentials then click Service account
- On the Create service account page, enter the Service account details
- Fill in the
Service account detailsand then clickCreate and Continue - On the
Grant this service account access to projectsection, add theLogs Viewerrole andLogs View Accessorrole underLoggingto the service account. ClickDone - In the next step, click the service account you just created. Under the
Keystab and selectAdd keyandCreate new key - Choose key type
JSONand clickCreate. A JSON key file will be created and downloaded to your computer
If you want to access logs in multiple cloud projects, you need to ensure the service account has permission to read logs from all of them.
If you host Grafana on a GCE VM, you can also use the Compute Engine service account. You need to make sure the service account has sufficient permissions to access the scopes and logs in all projects.
Similar to Prometheus data sources on Google Cloud, you can also configure a scheduled job to use an OAuth2 access token to view the logs. Please follow the steps in the data source syncer README to configure it.
You can also configure the plugin to use service account impersonation.
You need to ensure the service account used by this plugin has the iam.serviceAccounts.getAccessToken permission. This permission is in roles like the Service Account Token Creator role (roles/iam.serviceAccountTokenCreator). Also, the service account impersonated
by this plugin needs logging read and project list permissions.
- With Grafana restarted, navigate to
Configuration -> Data sources(or the route/datasources) - Click "Add data source"
- Select "Google Cloud Logging"
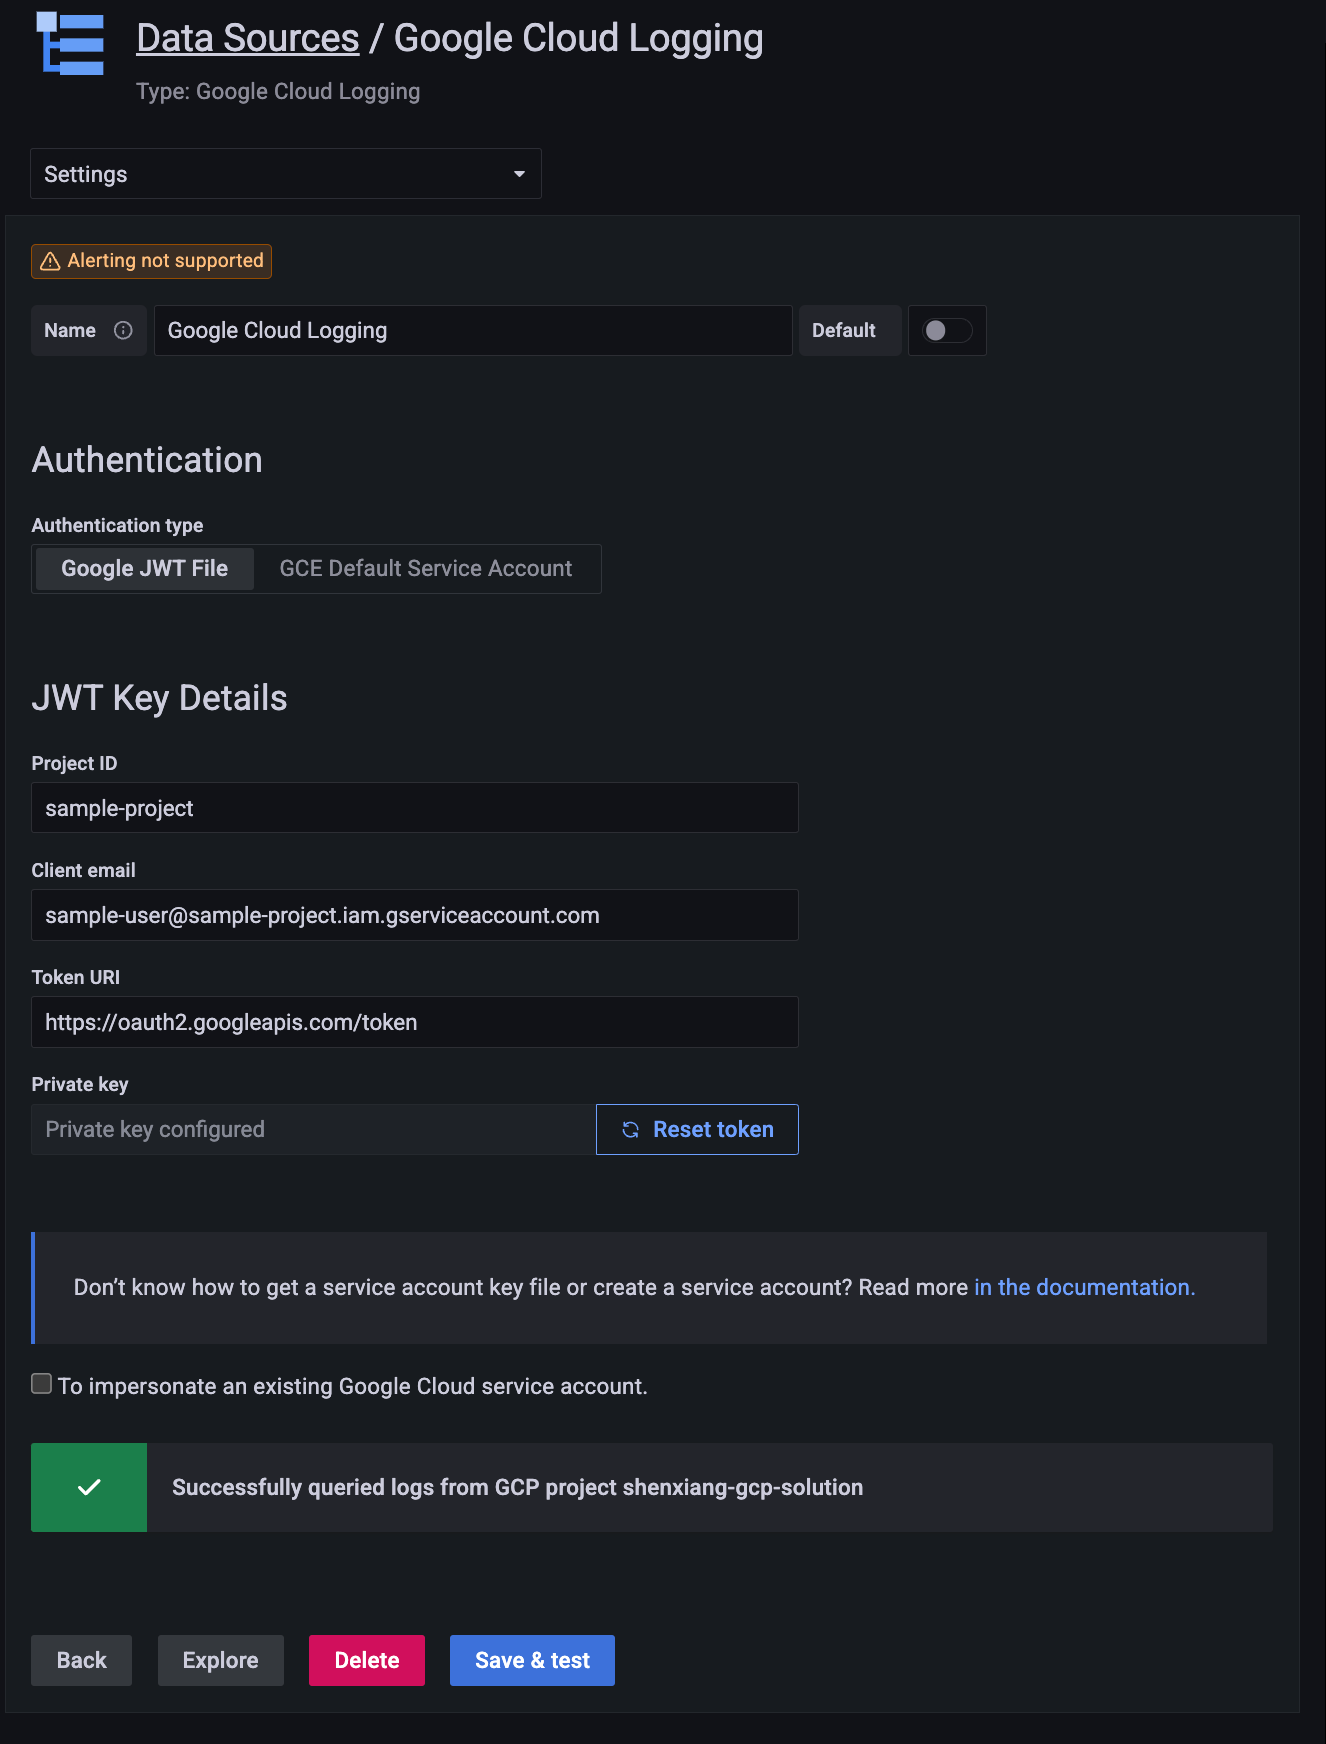
- Provide credentials from your JWT file, either by uploading it using the file selector or by pasting its contents directly into the designated field
- Click "Save & test" to test that logs can be queried from Cloud Logging
After the plugin is installed, you can define and configure the data source in YAML files as part of Grafana’s provisioning system, similar to the Google Cloud Monitoring plugin. For more information about provisioning, and for available configuration options, refer to Provisioning Grafana.
The following YAML is an example.
apiVersion: 1
datasources:
 - name: Google Cloud Logging
 type: googlecloud-logging-datasource
 access: proxy
 jsonData:
 authenticationType: gce
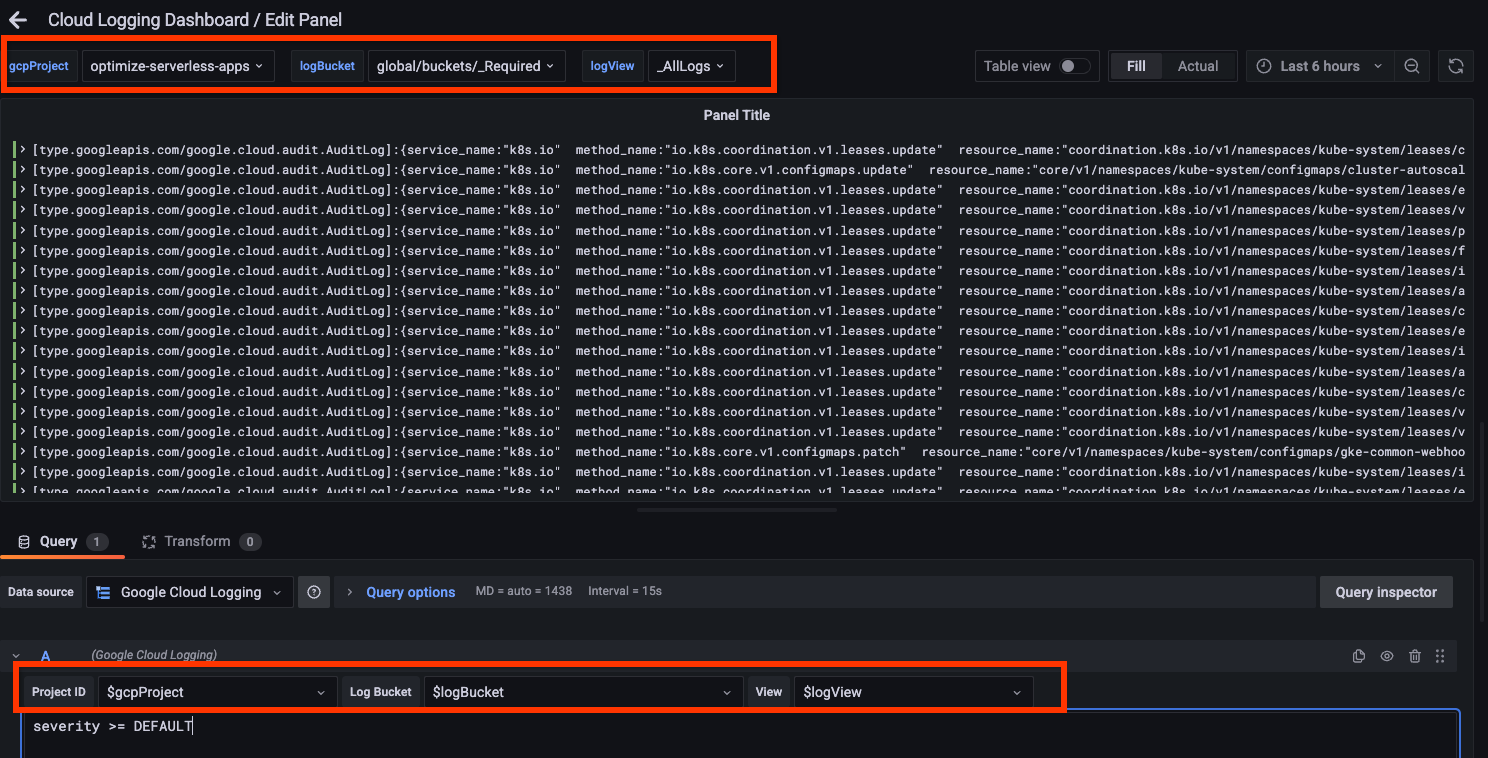
The plugin currently supports variables for logging scopes. For example, you can define a project variable and switch between projects. The following screenshot shows an example using project, bucket, and view.
Below is an example of defining a variable for log views. define a variable
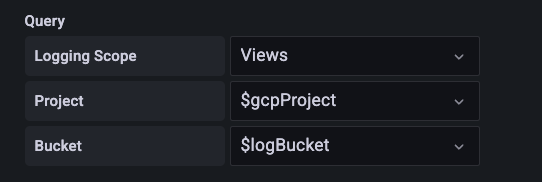
Grafana Alerting is not directly supported due to how Logging Query Language works on Google Cloud. If you need to create alerts based on logs, consider using Log-based metrics and a Cloud Monitoring data source.
Cloud Logging Logo (src/img/logo.svg) is from Google Cloud's Official icons and sample diagrams
As commented in the code, JWTForm and JWTConfigEditor are largely based on the Apache-2.0 licensed grafana-google-sdk-react.