Intro
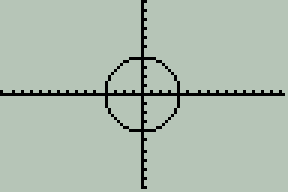
Given radius \$r\$, draw a circle in the center of the screen.
The Challenge
Here is a simple challenge.
Plot a circle using the formula \$x^2+y^2=r^2\$, or any other formula that will plot a circle according to the given parameters.
You may use any units that your language provides, so long as they are well defined and give consistent output.
The circle must have it's center at the center of the canvas, and must have a padding of 5 units or more on all sides.
The circle can have any fill that does not match the outline.
You may have axes in the background of your plot.
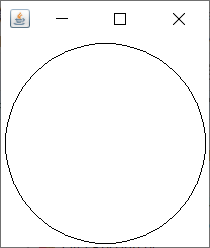
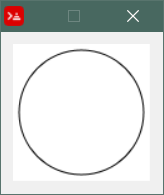
The outline of the circle must be solid (no gaps), and it must be visible. Here is an example:
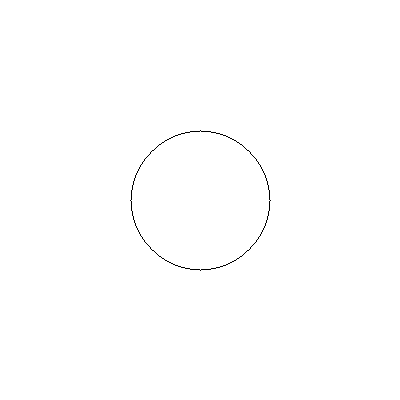
Input can be taken in any acceptable form. (function params, variables, stdin...)
Output can be in the form of a separate window, or an image format.
Standard loopholes and rules apply.
Example Code (Java + Processing)
// Modified from the C language example from
// https:// en.wikipedia.org/wiki/Midpoint_circle_algorithm
int r = 70; //radius
void settings() {
 size(2*r+10, 2*r+10);
}

void draw() {
 background(255);
 drawCircle(width/2, height/2, r, 60);
 save("Circle.png");
}

void drawCircle(int x0, int y0, int radius, int angle) {
 int circCol = color(0, 0, 0);
 float limit = radians(angle);
 int x = radius;
 int y = 0;
 int err = 0;

 while (x >= y && atan2(y, x) < limit) {
 set(x0 + x, y0 + y, circCol);
 set(x0 + y, y0 + x, circCol);
 set(x0 - y, y0 + x, circCol);
 set(x0 - x, y0 + y, circCol);
 set(x0 - x, y0 - y, circCol);
 set(x0 - y, y0 - x, circCol);
 set(x0 + y, y0 - x, circCol);
 set(x0 + x, y0 - y, circCol);

 y += 1;
 if (err <= 0) {
 err += 2*y + 1;
 }
 if (err > 0) {
 x -= 1;
 err -= 2*x + 1;
 }
 }
}
Scoring
This is a graphical-output question. No ascii art.
This is code-golf. shortest answer in each language wins.
-
\$\begingroup\$ What do you mean by 'the thickness of the outline must be 1 unit'? Are the units of outline thickness the same as those of the radius? \$\endgroup\$Dingus– Dingus2020年09月22日 06:49:51 +00:00Commented Sep 22, 2020 at 6:49
-
\$\begingroup\$ yes, it doesn't make sense. I changed it. \$\endgroup\$Razetime– Razetime2020年09月22日 06:53:17 +00:00Commented Sep 22, 2020 at 6:53
-
1\$\begingroup\$ Related (Draw a Polygon) \$\endgroup\$Jo King– Jo King2020年09月22日 08:04:13 +00:00Commented Sep 22, 2020 at 8:04
-
1\$\begingroup\$ You say there should be a padding of 5 units, what should happen if radius is bigger than window size? \$\endgroup\$LiefdeWen– LiefdeWen2020年09月22日 08:36:11 +00:00Commented Sep 22, 2020 at 8:36
-
1\$\begingroup\$ If we can zoom, wouldn't the same constant-sized circle, not showing axes, work for any input? \$\endgroup\$att– att2020年09月23日 06:58:04 +00:00Commented Sep 23, 2020 at 6:58
32 Answers 32
Desmos, 1 byte
r
Uses the same input method as the other Desmos answer. An unused variable named r defaults to drawing a circle with radius r.
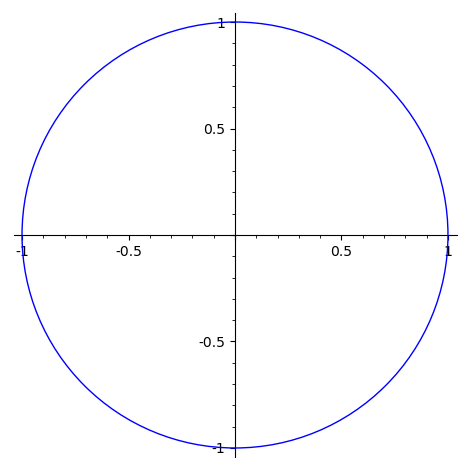
R, (削除) 74 (削除ここまで) (削除) 70 (削除ここまで) (削除) 68 (削除ここまで) (削除) 65 (削除ここまで) 54 bytes
Edit: -11 bytes thanks to Giuseppe
function(r)plot(r*1i^(1:1e3/99),,"l",l<-c(-r-5,r+5),l)
I propose 3 possible answers to this challenge in R, of decreasing length but with increasing caveats.
My favourite answer (above, using plot) is the (削除) middle (削除ここまで) shortest one of the 3. It plots a circle by calculating the complex coordinates of powers of i, using 396 points (with a bit of wrap-around). Here's an image of the output from plot_circle(5):
For a 'true' circle (rather than an almost-circle with tiny straight-lines connecting the data points), we can use the curve function with a formula, but unfortunately we need to draw the positive & negative halves separately, so it ends up longer:
R, (削除) 86 (削除ここまで) 84 bytes
function(r){curve((r^2-x^2)^.5,xli=l<-c(-r-5,r+5),yli=l)
curve(-(r^2-x^2)^.5,add=T)}
(削除) The shortest (that I can think of) (削除ここまで) Previously the shortest, but - thanks to Giuseppe now no longer so - is to use the circles option of the symbols function, for only 56 bytes. However, this has the caveat that the circle symbols are always circular even if the plot is re-sized, and so may no-longer line-up with the y-axis.
R, (削除) 62 (削除ここまで) (削除) 58 (削除ここまで) 56 bytes
function(r)symbols(x=1,c=r,i=F,xli=l<-c(-r-4,r+6),yli=l)
-
\$\begingroup\$ would
pty="s"work instead of setting thexlimandylimfor the first 2? I was digging through the documentation forparbut haven't had a chance to test it. It says"s"generates a square plotting region \$\endgroup\$Giuseppe– Giuseppe2020年09月22日 16:18:55 +00:00Commented Sep 22, 2020 at 16:18 -
\$\begingroup\$ @Giuseppe
par(pty="s")should work but then it wouldn't satisfy the condition of 5 units of padding. In fact, from what I can see, only this answer satisfies the padding condition! Withoutpar(pty="s")the circle depends on the output device being square, since the device will otherwise stretch. \$\endgroup\$Therkel– Therkel2020年09月23日 07:15:55 +00:00Commented Sep 23, 2020 at 7:15 -
1\$\begingroup\$ @Therkel - welcome (back) to code-golf, and, in case you weren't aware, R is the language of the month this month (Sept 2020)! As you obviously know R, how about giving a shot at a couple of R-golfs...? \$\endgroup\$Dominic van Essen– Dominic van Essen2020年09月23日 07:37:14 +00:00Commented Sep 23, 2020 at 7:37
-
1\$\begingroup\$ @Therkel I completely missed the 5 padding requirement. Seems a bit random to be honest. At the least, you can use the order of variables in
plotto get the first down to 54 bytes; presumably similar golfs would work for the others. \$\endgroup\$Giuseppe– Giuseppe2020年09月23日 14:24:54 +00:00Commented Sep 23, 2020 at 14:24 -
1\$\begingroup\$ well, I googled "R plot" and went to the first result from the stat.ethz.ch site (which I always do when googling R documentation), which luckily was the page for
plot.default! The docs forplotsayplot.defaultwill be used for simple scatterplots, so I suppose I lucked out somewhat :-) \$\endgroup\$Giuseppe– Giuseppe2020年09月23日 15:03:22 +00:00Commented Sep 23, 2020 at 15:03
Python 2 & 3, 55 bytes
-17 bytes thanks to @DigitalTrauma
-1 byte thanks to @Sisyphus
-2 bytes thanks to @ovs
from turtle import*
def f(r):sety(-r);clear();circle(r)
turtle is standard library included in Python 2 & 3. I came up with turtle idea as a almost first result in Googling "graphics python".
-
1\$\begingroup\$ If window is allowed to be closed automatically after drawing is done, then
done()can be removed from end of code, it just prevents window from closing. \$\endgroup\$Arty– Arty2020年09月22日 16:10:54 +00:00Commented Sep 22, 2020 at 16:10 -
1\$\begingroup\$ so long as it displays the circle, even for a frame, there is no problem. I think you can remove int() from int(input()) as well. \$\endgroup\$Razetime– Razetime2020年09月22日 16:11:38 +00:00Commented Sep 22, 2020 at 16:11
-
1\$\begingroup\$
fd()is an alias offorward(). Also you can usegoto()to set the start position: 60 bytes with the other suggestions \$\endgroup\$Digital Trauma– Digital Trauma2020年09月22日 16:26:20 +00:00Commented Sep 22, 2020 at 16:26 -
1\$\begingroup\$ This is a really cool approach, and I can't believe there aren't more turtle golfs in Python! \$\endgroup\$Dominic van Essen– Dominic van Essen2020年09月23日 08:06:17 +00:00Commented Sep 23, 2020 at 8:06
-
1\$\begingroup\$ @DominicvanEssen I came up with
turtlesolution as a first result in Googling "graphics python". \$\endgroup\$Arty– Arty2020年09月23日 09:09:25 +00:00Commented Sep 23, 2020 at 9:09
LaTeX, 66 bytes
\input tikz\def\f#1{~\vfill\centering\tikz\draw circle(#1);\vfill}
I consider the "canvas" required by this challenge to be the default text area of a latex page. The code defines a macro \f that takes the radius in cm as an argument.
Example Code
\documentclass{article}
\input tikz\def\f#1{~\vfill\centering\tikz\draw circle(#1);\vfill}
\begin{document}
\f{3}
\enddocument
Outputs a PDF:
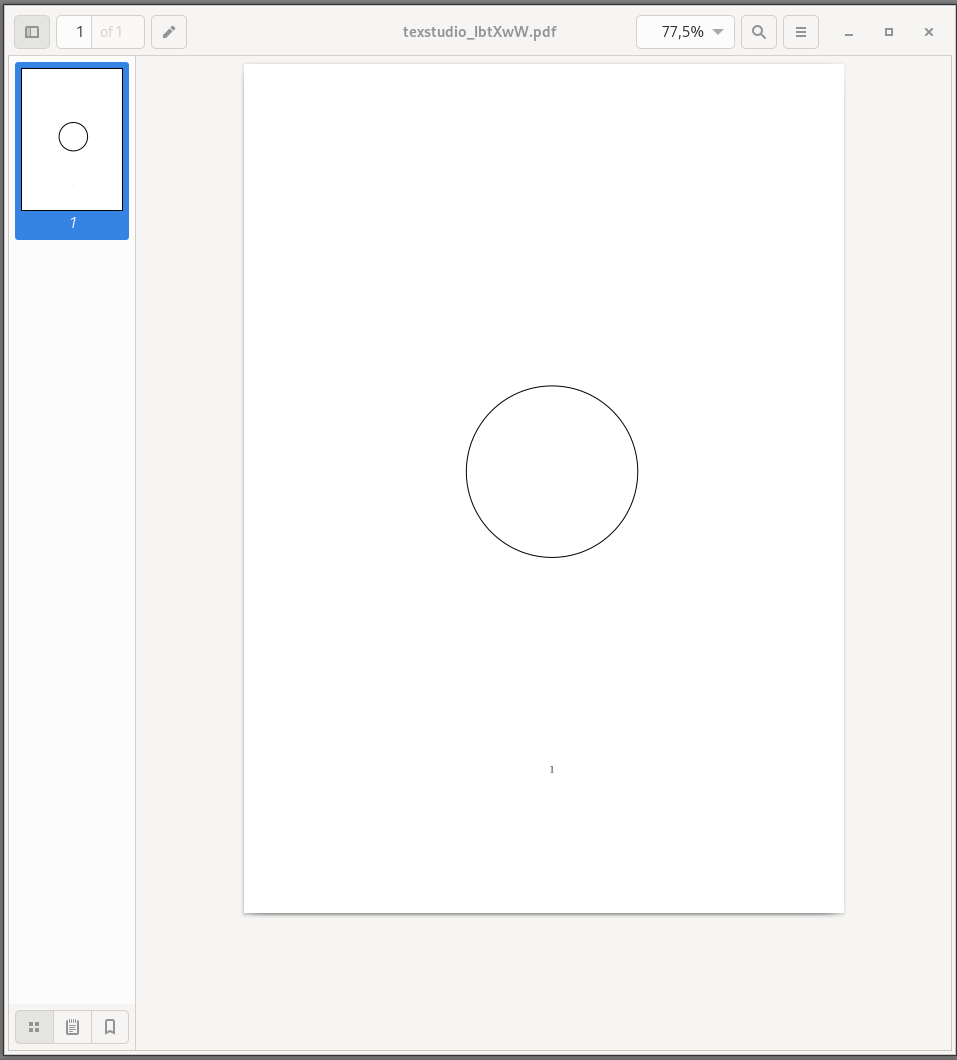
-
\$\begingroup\$ How is the input given? \$\endgroup\$Razetime– Razetime2020年10月28日 11:02:32 +00:00Commented Oct 28, 2020 at 11:02
-
1\$\begingroup\$ Oh, I missed that part. Let me change it. \$\endgroup\$corvus_192– corvus_1922020年10月28日 11:11:24 +00:00Commented Oct 28, 2020 at 11:11
C (gcc), (削除) 169 (削除ここまで) (削除) 166 (削除ここまで) (削除) 161 (削除ここまで) 160 bytes
Thanks to ceilingcat (x3) for the suggestions! I also changed the newlines in the header to spaces as they seem to work fine as separators (at least in Irfanview) and fixed a bug that got revealed when the array was put on the stack.
Generates an image in PBM format, as it's probably the simplest way to make a bitmap! For some reason, all the online PBM viewers that I tried don't seem to like the output file, but Irfanview and GIMP are fine with it.
z;f(r,w){char s[(w=r*2+11)*w+1];float x=s[w*w]=!memset(s,48,w*w);for(;x<7;)s[z=round(sin(x+=1e-5)*r+r+5)+round(cos(x)*r+r+5)*w]=49;printf("P1 %d %d %s",w,w,s);}
-
-
\$\begingroup\$ Save 21 bytes with
z,x;f(r,w){char s[(w=r*2+11)*w+1];for(x=!memset(s,48,w*w);x<7e5;)s[z=sin(++x)*r+r+5+round(cos(x)*r+r+5)*w]=49;printf("P1 %d %d %s",w,w,s);}. No need for the firstroundand to keep x below 7 (or 2π) . \$\endgroup\$Kjetil S– Kjetil S2020年09月24日 21:57:30 +00:00Commented Sep 24, 2020 at 21:57
T-SQL, 47 bytes
SELECT geometry::Point(0,0,0).STBuffer(r)FROM t
Input is taken via a pre-existing table t with float field r, per our IO rules.
Uses SQL geo-spatial functions, displayed in the SQL Management Studio results pane:
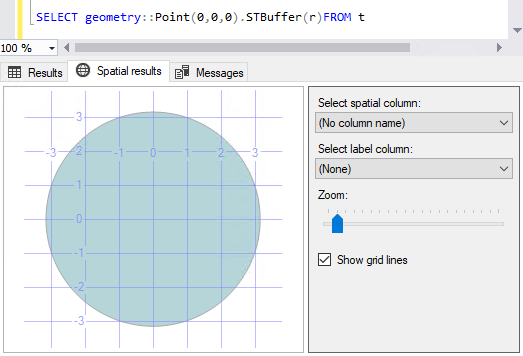
TI-Basic, (削除) 11 (削除ここまで) (削除) 8 (削除ここまで) 7 bytes
Polar
Input r1
ZSquare
Input is a string, and is stored as a function. This function is shown in polar coordinates, so it shows as a circle.
Output for "4:
-
2\$\begingroup\$ +1, looks like sniping target XD \$\endgroup\$avarice– avarice2021年06月14日 07:42:15 +00:00Commented Jun 14, 2021 at 7:42
JavaScript (ES6), 96 bytes
f=
v=>`<svg width=${s=v*2+12} height=${s}><circle r=${v} cx=${v+=6} cy=${v} stroke=#000 fill=none>`
<input type=number min=1 oninput=o.innerHTML=f(+this.value)><div id=o>Outputs an SVG(HTML5) image, which the snippet displays for you. If HTML5 is acceptable, then for 95 bytes:
f=
v=>`<div style="width:${v*=2}px;height:${v}px;margin:6px;border:1px solid;border-radius:100%">`
<input type=number min=1 oninput=o.innerHTML=f(+this.value)><div id=o>-
\$\begingroup\$ feel free to use html5 for your main answer. \$\endgroup\$Razetime– Razetime2020年09月22日 09:46:02 +00:00Commented Sep 22, 2020 at 9:46
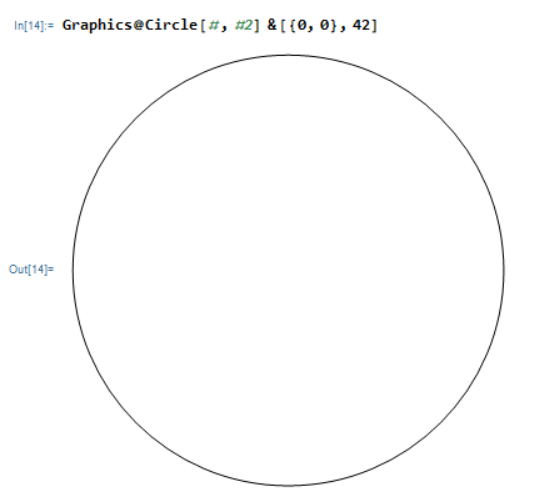
Wolfram Language (Mathematica), 16 bytes
Graphics@*Circle
See Wolfram documentation on Circle
for example here is a circle with center (0,0) and radius r=42
-6 bytes from @LegionMammal978
-
\$\begingroup\$ The specifications call for a single input, the radius. On the other hand, Mathematica should center the circle in the plot window automatically, regardless of the center. \$\endgroup\$Greg Martin– Greg Martin2020年09月22日 15:40:51 +00:00Commented Sep 22, 2020 at 15:40
-
\$\begingroup\$ @GregMartin "...or any other formula that will plot a circle according to the given parameters". Do you thing you you have a shortest solution? I don't think that
Circle[]is acceptable, so this is the shortest way. \$\endgroup\$ZaMoC– ZaMoC2020年09月22日 19:10:18 +00:00Commented Sep 22, 2020 at 19:10 -
\$\begingroup\$ You could just use
Graphics@Circle@##&, or shorter yet,Graphics@*Circle. \$\endgroup\$LegionMammal978– LegionMammal9782020年09月24日 12:16:49 +00:00Commented Sep 24, 2020 at 12:16 -
\$\begingroup\$ @LegionMammal978 yes, you're right.. \$\endgroup\$ZaMoC– ZaMoC2020年09月24日 12:35:12 +00:00Commented Sep 24, 2020 at 12:35
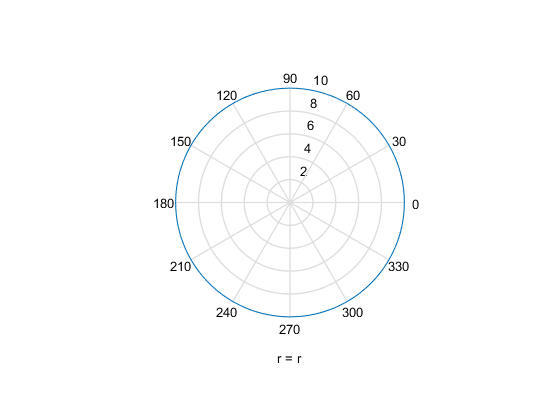
MATLAB, (削除) 38 (削除ここまで) 37 bytes
-1 byte thanks to Tom Carpenter
ezpolar(@(x)r);axis((r+5)*cospi(1:4))
Input as variable r in workspace.
Output:
output
-
1\$\begingroup\$ Ignore my previous deleted comments, forgot the circle had to be centred. You can save a byte with
ezpolar(@(x)r);axis((r+5)*cospi(1:4)). Thecospi(1:4)gives you[-1 1 -1 1]which can be multipled directly with(r+5)to get your limits array. \$\endgroup\$Tom Carpenter– Tom Carpenter2020年09月24日 17:49:15 +00:00Commented Sep 24, 2020 at 17:49
<>^v, 56 bytes
ƒ∆57±∑361i∆90v
v 0Ii(I< a <
] ^
>¶° ^
>1 æ∑ ^
Explanation
ƒ : toggle turtle visibility
∆ : raise pen
57: push 57
± : negate
∑ : turtle forward by top of stack
361: push 361 (360 + 1)
i : pop stack & store in variable i
∆ : lower pen
90: push 90
v : send instruction pointer down
< : send instruction pointer left
a : turtle rotate right by top of stack (90)
start of loop
< : send instruction pointer left
I : push value of variable i
( : decrement top of stack
i : pop & store in variable i
I : push value of variable i
0 : push 0
v : send instruction pointer down
] : if top of stack is greater than or equal to second element of stack\
>: send instruction pointer right¶: update display- continue to continue here\
Else
> : send instruction pointer right
1: push 1
æ : turn left (top of stack) degrees
∑ : go forward by top of stack
^ : send instruction pointer up
continue here
^ : send instruction pointer up
^ : Idem, there to ensure trailing whitespace is not removed
go to start of loop
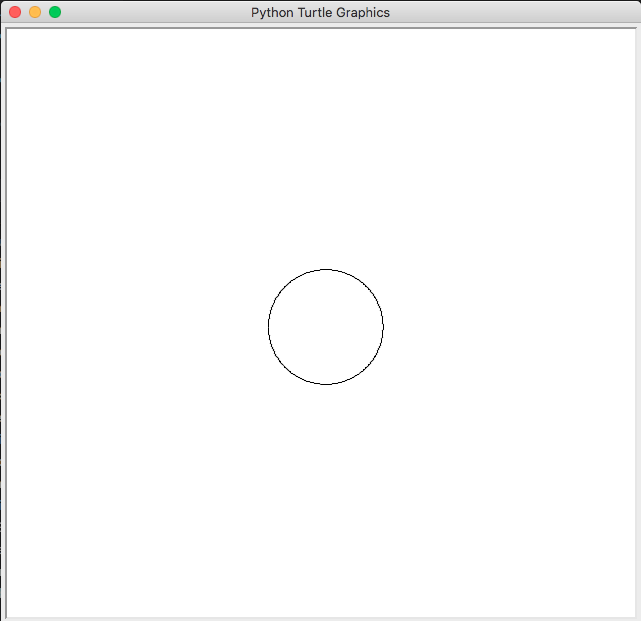
After drawing the circle, the program never halts to prevent the window from closing.
Screenshot below (Python Turtle Graphics is because the program does not set a title to the window and the interpreter is written in Python and uses Turtle for graphics) : screenshot
-
\$\begingroup\$ Welcome to Code Golf! \$\endgroup\$Makonede– Makonede2021年06月13日 23:57:45 +00:00Commented Jun 13, 2021 at 23:57
-
\$\begingroup\$ does this take input? \$\endgroup\$Razetime– Razetime2022年03月18日 04:55:57 +00:00Commented Mar 18, 2022 at 4:55
-
\$\begingroup\$ @Razetime No, it doesn't \$\endgroup\$astroide– astroide2022年03月18日 11:53:52 +00:00Commented Mar 18, 2022 at 11:53
-
\$\begingroup\$ Just realized how stupid what I just said was. Didn't see the program ought to take a radius input. I'll update it as soon as possible. \$\endgroup\$astroide– astroide2022年03月18日 11:56:25 +00:00Commented Mar 18, 2022 at 11:56
-
\$\begingroup\$ Is there a way to center the plot/zoom in desmos using code? \$\endgroup\$Razetime– Razetime2020年09月22日 06:15:33 +00:00Commented Sep 22, 2020 at 6:15
-
\$\begingroup\$ @Razetime if you've zoomed away from centre, press the home button. \$\endgroup\$2020年09月22日 06:16:13 +00:00Commented Sep 22, 2020 at 6:16
-
\$\begingroup\$ I mean, for r=50, the circle extends outside the screen. is there a way to zoom to fit? \$\endgroup\$Razetime– Razetime2020年09月22日 06:17:25 +00:00Commented Sep 22, 2020 at 6:17
-
1\$\begingroup\$ i mean, programatically. \$\endgroup\$Razetime– Razetime2020年09月22日 06:26:19 +00:00Commented Sep 22, 2020 at 6:26
-
1\$\begingroup\$ MATL should work for that. It's available online. \$\endgroup\$Razetime– Razetime2020年09月22日 06:54:15 +00:00Commented Sep 22, 2020 at 6:54
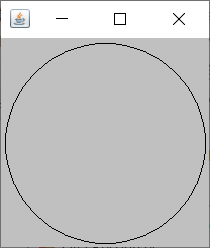
Java 8, (削除) 141 (削除ここまで) 123 bytes
import java.awt.*;r->new Frame(){{setSize(2*r+26,2*r+56);show();}public void paint(Graphics g){g.drawOval(13,43,2*r,2*r);}}
Output for \$n=100\$ (the second picture with added light grey background color is to verify the top padding):
enter image description here enter image description here
Explanation:
import java.awt.*; // Required import for Frame and Graphics
r-> // Method with integer parameter and Frame return-type
 new Frame(){ // Create the Frame
 { // In an inner code-block:
 setSize(2*r // Set the width to 2 times the radius-input
 +26 // + 2 times 8 pixels for the frame borders
 // + 2 times 5 pixels for the required padding
 2*r // Set the height to 2 times the radius-input
 +56); // + 2 times 8 pixels for the frame borders
 // + 30 pixels for the frame title-bar
 // + 2 times 5 pixels for the required padding
 show();} // And show the Frame at the end
 public void paint(Graphics g){
 // Overwrite its paint method to draw on
 g.drawOval(13,43, // With 5,5 for the required padding as top-left
 // x,y-coordinate of the surrounding rectangle + the same 8+30
 // pixels adjustment for the frame and frame title-bar,
 2*r,2*r);}} // draw the circle with a size of 2 times the radius-input
Note: I cannot use (r*=2),r,r,r instead of 2*r,2*r,2*r,2*r to save (3) bytes, because r has to be effectively final inside the inner Frame-class.
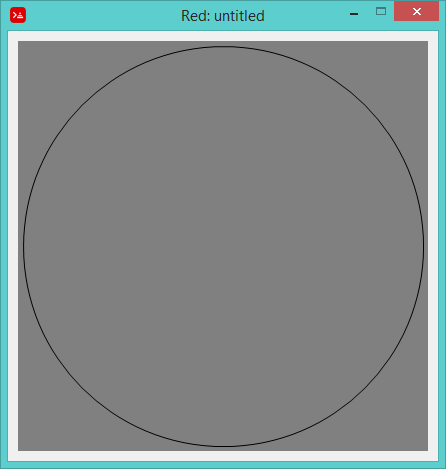
Red, 74 bytes
-16 bytes thanbks to Aaron Miller!
func[r][d: r + 5 view compose/deep[base(2x2 * d)draw[circle(1x1 * d)(r)]]]
Red, 90 bytes
func[r][d: r + 5 view compose/deep[base(as-pair d * 2 d * 2)draw[circle(as-pair d d)(r)]]]
f 200
-
1\$\begingroup\$ 74 bytes \$\endgroup\$Aaroneous Miller– Aaroneous Miller2021年06月07日 14:12:50 +00:00Commented Jun 7, 2021 at 14:12
-
\$\begingroup\$ @AaronMiller Thank you! \$\endgroup\$Galen Ivanov– Galen Ivanov2021年06月07日 14:16:45 +00:00Commented Jun 7, 2021 at 14:16
JavaScript (V8), 158 bytes
r=>document.write(`<p style="border-radius:50%;border:solid;position:fixed;width:${r*2}px;height:${r*2}px;top:50%;left:50%;transform:translate(-50%,-50%);">`)
jsfiddle thanks to @Razetime
- Saved 1 thanks to @Razetime
- Saved 2 using template literals
Writes directly to the HTML a p element fixed positioned, centered with border radius 50%
-
-
\$\begingroup\$ Yes @Razetime thanks, I tried but it's really hard from a phone :/ \$\endgroup\$AZTECCO– AZTECCO2020年09月23日 06:41:14 +00:00Commented Sep 23, 2020 at 6:41
-
1\$\begingroup\$ oh, gotcha. I think border-radius 50% is enough, so -1 byte. \$\endgroup\$Razetime– Razetime2020年09月23日 06:43:01 +00:00Commented Sep 23, 2020 at 6:43
-
\$\begingroup\$ The jsfiddle link just gives me a bouncing cloud with an infinity sign... So (without having actually witnessed the output): does border-radius 50% satisfy the "must have a padding of 5 units or more on all sides" when r<10? \$\endgroup\$Dominic van Essen– Dominic van Essen2020年09月23日 07:59:35 +00:00Commented Sep 23, 2020 at 7:59
-
\$\begingroup\$ The circle is always at the center of the screen, due to top and left:50% \$\endgroup\$Razetime– Razetime2020年09月23日 15:17:07 +00:00Commented Sep 23, 2020 at 15:17
Shadertoy (GLSL), 142 bytes
void mainImage(out vec4 f,in vec2 v){vec2 S=iResolution.xy;vec2 u=v/S-vec2(0.5);u.y/=S.x/S.y;vec4 c;if(abs(length(u)-0.2)<8e-4)c=vec4(1);f=c;}
Output:
-
\$\begingroup\$ 85 bytes: void mainImage(out vec4 f,in vec2 v){v-=vec2(400,225);f=vec4(abs(dot(v,v)-1e4)<1e2);} \$\endgroup\$PrincePolka– PrincePolka2021年07月06日 15:51:42 +00:00Commented Jul 6, 2021 at 15:51
-
\$\begingroup\$ My above code might not apply with the challenge, does print a circle though \$\endgroup\$PrincePolka– PrincePolka2021年07月08日 18:00:51 +00:00Commented Jul 8, 2021 at 18:00
Red, (削除) 96 (削除ここまで) (削除) 92 (削除ここまで) 87 bytes
Forgot to remove some extra whitespace for -4 bytes.
-5 bytes by using shorter type conversions and initializing and using x at the same time.
draw to-pair x: r * 9 to-block append"circle "append mold to-pair x / 2 append" "mold r
No TIO link because draw doesn't seem to be implemented on TIO. However, you can copy this into the Red offline interpreter to output an image.
The first line is for defining a variable to be used for the canvas size. Multiplying by 9 might be a bit overkill, but it ensures enough padding around the circle. I couldn't figure out how to use variables in the block, so the second line builds the draw command bit by bit, essentially building the command draw {x}x{x} [circle {x / 2}x{x / 2} {r}].
Example output for \$r = 10\$:
Red, (削除) 59 (削除ここまで) (削除) 57 (削除ここまで) (削除) 55 (削除ここまで) 51 byte
func[r][?(draw 2 * c: 5x5 + r reduce['circle c r])]
Try it locally.
-2 bytes thanks to Aaron Miller spotting superfluous as-pair.
Output for \$r=50\$:
-
\$\begingroup\$ Nice solution! Great use of the tools provided by the GUI console! \$\endgroup\$Galen Ivanov– Galen Ivanov2021年06月02日 08:39:17 +00:00Commented Jun 2, 2021 at 8:39
Python + pygame, 110 bytes
r=int(input())
d=display
s=5+r
draw.circle(d.set_mode([s+s]*2),[99]*3,[s]*2,r,1)
d.update()
We only use set_mode once, so we can pass it as an argument to draw.circle.
It's almost impossible to golf in Pygame so this is probably the shortest it can get, although I could change 99 to 9.
Example for 250: enter image description here
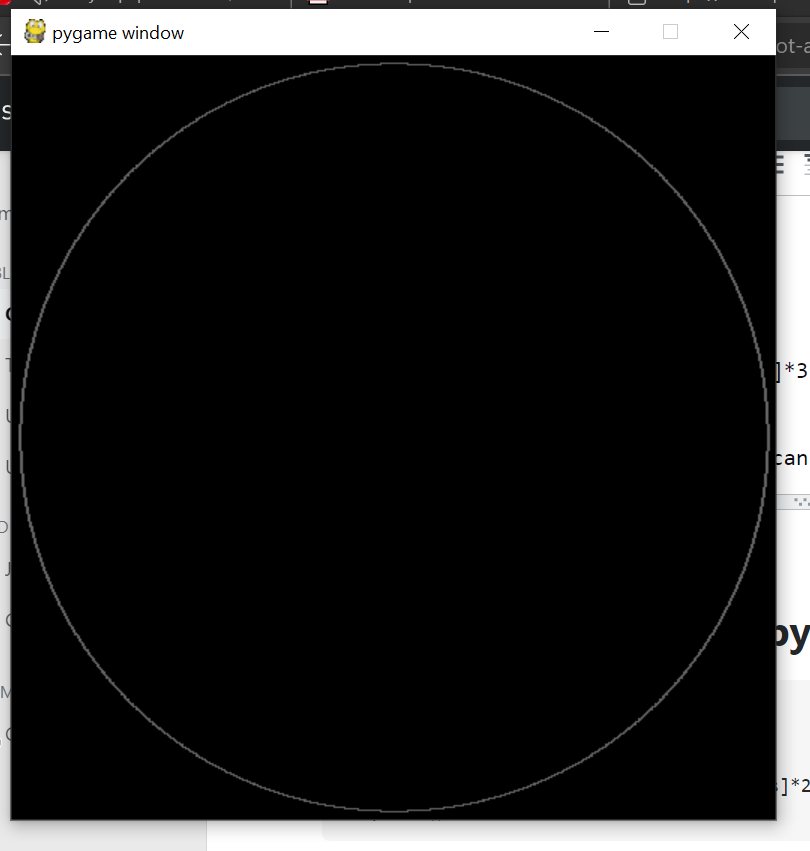
80186 DOS machine code, (削除) 76 (削除ここまで) (削除) 74 (削除ここまで) (削除) 72 (削除ここまで) 71 bytes
00000000: b8 13 00 cd 10 1e 68 00 a0 1f f7 df 8d 6d 02 01 ......h......m..
00000010: fd 31 c0 f7 df e8 20 00 f7 df 97 e8 1a 00 89 eb .1.... .........
00000020: 39 df e8 0a 00 97 39 fb e8 04 00 75 e6 1f 7c 06 9.....9....u..|.
00000030: 01 fd 8d 6b 03 47 c3 e8 00 00 69 d8 40 01 fe 81 ...k.G....i.@...
00000040: a0 7d f7 df f7 d8 c3 .}.....
A function which expects the radius in di. Forces DOS to graphics mode and doesn't bother to clean up.
I am mostly just excited about getting it working, I will hopefully find some ways to optimize.
Translation of the Go version of the Midpoint circle algorithm from Rosetta Code.
- 2 bytes: branch once in
correctinstead of branching twice in the main function - 2 bytes: reuse flags from
incfor loop trigger. - 1 byte: Fall through to
correctwhen returning.
Commented assembly
 ; nasm file.asm -f obj -o file.obj
 [cpu 186]
 global draw_circle
 ; args: di: radius
draw_circle:
 ; switch DOS to graphics mode
 mov ax, 0x0013
 int 0x10
 ; set ds to point to the screen buffer
 push ds
 push 0xA000
 pop ds
 ; http://rosettacode.org/wiki/Bitmap/Midpoint_circle_algorithm#Go
 ; di => x1
 neg di
 ; bp => err
 lea bp, [2 + di]
 add bp, di
 ; ax => y1
 xor ax, ax
.loop:
 neg di
 ; x - x1, y + y1
 ; x + x1, y - y1
 call set_pixel
 neg di
 ; swap
 xchg ax, di
 ; x + y1, y + x1
 ; x - y1, y - x1
 call set_pixel
 ; ax: x1, di: y1

 ; save err to bx
 mov bx, bp
 ; check y1
 ; we branch in correct
 cmp di, bx
 call correct
 ; swap back
 xchg ax, di
 ; check x1, using the opposite order
 cmp bx, di
 call correct
 ; loop while x1 is negative
 ; the flags will be set from correct
 jnz .loop
 ; restore ds segment
 pop ds
 ; uncomment to wait for enter then switch to
 ; standard mode
 ; mov ah, 0x08
 ; int 0x21
 ; mov ax, 0x0003
 ; int 0x10
 ; Fallthrough to exit
 ; some helper functions to cut down the copy-paste
correct:
 ; The flags will be set to the comparison before
 ; calling
 jl .skip
 ; err += 2 * ++di + 1
 add bp, di
 lea bp, [bp + di + 3]
 ; ++di
 inc di
.skip:
 ret
 ; ax: y, di: x
set_pixel:
 ; run twice by semi-recursion
 call .semirecurse
.semirecurse:
 ; ++byte[x + 160 + (320 * (y + 100))]
 imul bx, ax, 320
 inc byte[di + bx + 0x7DA0]
 ; negate both here
 neg di
 neg ax
 ret
with radius = 50, showing the disgusting exit: enter image description here
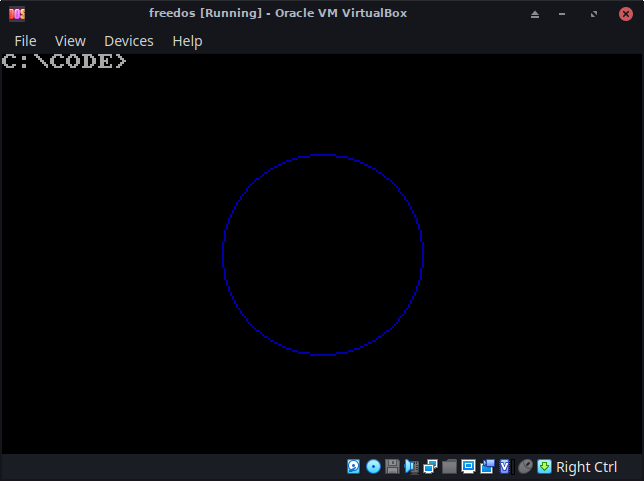
Perl 5, 92 bytes
$r=$_;
$w=$r*2+11;
$_="P1 $w $w @{[map{($_%$w-$r-5)**2+($_/$w-$r-5)**2<$r**2?1:0}0..$w**2-1]}"
Circle with black filling. Put the 92 bytes above into program.pl and run like this:
echo 50 | perl -p program.pl > circle.pbm # radius 50
feh circle.pbm # view with feh or other image viewer
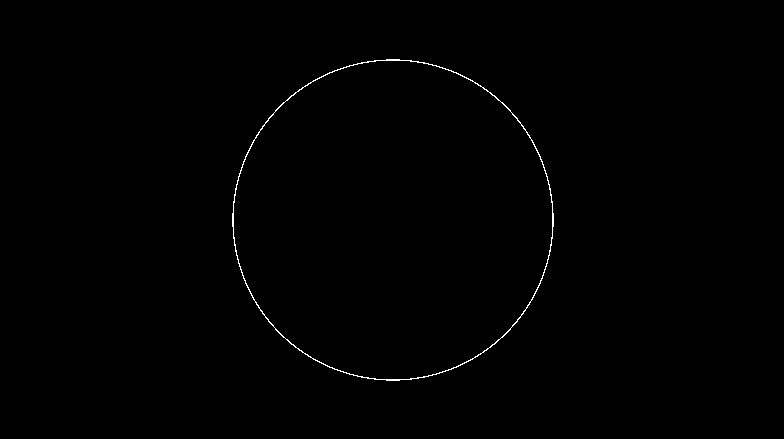
PHP, 131 bytes
($f=imagecolorallocate)($i=imagecreate($d=10+$argn*2,$d),0,0,0);imageellipse($i,$d/2,$d/2,$d-10,$d-10,$f($i,9,9,9));imagepng($i,a);
Actually you cannot run it in online PHP testers because they disable the image functions. Saves the image in a file named "a". One byte could be saved using imagegd but I didn't know the "gd" format and couldn't open it to check if it works.
The circle is in very dark grey, but I consider it visible. If you don't, leave a comment and I'll edit, with one byte more $f($i,99,0,0) it's much clearer.
with $f($i,9,9,9):
with $f($i,99,0,0):
-
\$\begingroup\$ dark grey is different from black, so it's alright. I can see the circle. \$\endgroup\$Razetime– Razetime2020年10月01日 10:16:27 +00:00Commented Oct 1, 2020 at 10:16
Swift, entire iOS app, 152 bytes
project.pbxproj not included.
import SwiftUI
@main struct A:App{@State var s="1"
var body:some Scene{WindowGroup{VStack{TextField("",text:$s)
Circle().frame(width:.init(Int(s)!))}}}}
The unit for the radius is 0.5pt, which is either 1px or 1.5px depending on the device. The app crashes if you type something that isn't an integer.
Preview, with a radius of 50pt:
1
Ungolfed
import SwiftUI
@main
struct MyApp: App {
 var body: some Scene {
 WindowGroup {
 ContentView()
 }
 }
}
struct ContentView: View {
 @State private var text = "1"
 var body: some View {
 VStack {
 TextField("", text: $text)
 Circle()
 .frame(width: CGFloat(Int(text)!))
 }
 }
}
-
\$\begingroup\$ does this take input? \$\endgroup\$Razetime– Razetime2022年03月18日 04:54:50 +00:00Commented Mar 18, 2022 at 4:54
-
\$\begingroup\$ No, it doesn’t respond to user interaction at all. \$\endgroup\$Bbrk24– Bbrk242022年03月18日 11:40:54 +00:00Commented Mar 18, 2022 at 11:40
-
\$\begingroup\$ the question requires a method of input to scale the circle. \$\endgroup\$Razetime– Razetime2022年03月18日 11:49:09 +00:00Commented Mar 18, 2022 at 11:49
-
\$\begingroup\$ Oh, you’re right, I missed that. I can’t fix it now but I can get to it later today. \$\endgroup\$Bbrk24– Bbrk242022年03月18日 11:50:23 +00:00Commented Mar 18, 2022 at 11:50
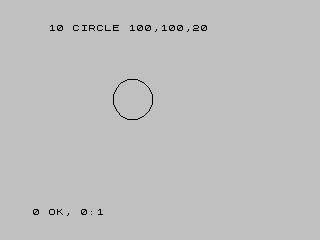
ZX Spectrum BASIC, 1, 3 or 6 bytes
Nothing beats BASIC computers with bitmap graphics that consider a case of honour to implement the built in CIRCLE command...
CIRCLE x,y,r
The command takes just one byte (though it is printed as the whole word), depending on what and how do you count the size, it can be 1 byte (the command itself), 3 bytes (the command and obligatory commas separating the articles; note that the space is only visual), 6 bytes (the command, commas and three already defined variables (or PI)).
-
\$\begingroup\$ you must input radius and center it in the screen. x and y are not specified inputs, and must not be taken. predefined variables are not allowed in a submission. \$\endgroup\$Razetime– Razetime2022年03月19日 01:40:06 +00:00Commented Mar 19, 2022 at 1:40
-
\$\begingroup\$ @Razetime from the question: "Input can be taken in any acceptable form. (function params, variables, stdin...)" - and these are function (or procedure, if you prefer) parameters. Also, the original example does not use any inputs, but defines variables. I think some clarification is needed... \$\endgroup\$Radovan Garabík– Radovan Garabík2022年03月19日 05:50:06 +00:00Commented Mar 19, 2022 at 5:50
-
\$\begingroup\$ Ok, sorry, only one predefined variable is allowed.
ris the only allowed input. you must define your entire program to make sure that it does not use any input other thanr(and center the circle). \$\endgroup\$Razetime– Razetime2022年03月19日 08:08:17 +00:00Commented Mar 19, 2022 at 8:08
PostScript, 69 bytes
currentpagedevice/PageSize get{2 div}forall
3 2 roll
0 360 arc stroke
Pass the radius on the command line:
gs -c 150 -- circle.ps
Displays output in a window, which then immediately closes! Add showpage for a persistent window. Centering the output took more bytes than I had hoped...
HTML + Javascript, 98
JavaScript: 85, HTML: 13
F=r=>{C.width=C.height=r*2+16;c=C.getContext`2d`;c.arc(r+8,r+8,r,0,6.283);c.stroke()}
F(100)
<canvas id=C>To change r, change r=100 to r=/*place your value here*/.
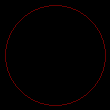
C (gcc), (削除) 132 (削除ここまで) 128 bytes
-4 bytes thanks to @ceilingcat
main(r,w,i,j){scanf("%d",&r);i=w=r+9;for(printf("P5\n%d%1$d\n1\n",2*w);i--+w;)for(j=w;j--+w;)putchar(abs((i*i+j*j)*2-r*r)<2*r);}
Outputs a PGM image.
A unit corresponds to sqrt(2) pixels.
Desmos, 3 bytes
r=1
Simply entering r, in my concern, doesn't work, but entering r=0 automatically makes it a slider.
r=0 doesn't create a circle. Sorry about that.
-
2\$\begingroup\$ Pasting this into desmos doesn't seem to produce a circle. \$\endgroup\$2022年05月09日 08:58:50 +00:00Commented May 9, 2022 at 8:58
-
\$\begingroup\$ @WheatWizard fixed \$\endgroup\$Number Basher– Number Basher2022年05月10日 04:45:06 +00:00Commented May 10, 2022 at 4:45