JavaScript, a versatile and powerful programming language, excels in creating dynamic web applications. However, debugging errors can be daunting, especially for beginners. Hidden within the complexities are techniques and tools that unlock your path to debugging enlightenment.
1. Use console.log() for Debugging
The console.log() statements are widely recognized as one of the simplest and most effective techniques for debugging code. It can provide you with a valuable means to output variables, function calls, and other pertinent information directly by logging into the browser console.
By strategically incorporating console.log() statements throughout your code, you can gain valuable insights into the state and flow of your program during runtime.
This technique proves particularly useful for inspecting variable values at specific points in the code, assisting you in the identification and resolution of unexpected behavior or errors.
Consider a basic function that takes two arguments and returns their sum:
function add(a, b) {
 return a + b;
}
To debug this function, console.log() statements can be added to check the argument values and the return value:
function add(a, b) {
 console.log("a:", a, "b:", b);
 const result = a + b;
 console.log("result:", result);
 return result;
}
When calling the function with test values, the output can be observed in the browser console.
add(2, 3); // Output: a: 2 b: 3, result: 5By strategically employing console.log() statements, the execution path can be effectively traced, problematic areas can be pinpointed, and valuable insights for debugging purposes can be gained.
This technique is useful for complex codebases or scenarios where traditional debugging methods may fall short. The ability to inspect and log relevant information directly to the browser console can equip you with a powerful tool for comprehending your code's behavior and can help you to resolve issues efficiently.
2. Use Breakpoints in the Browser Debugger
Another powerful debugging technique involves using breakpoints in the browser debugger. Breakpoints allow you to pause code execution at specific points, inspect variable and expression values, and step through the code line by line.
To set a breakpoint, simply click on the line number in the browser debugger's source code panel.
Once a breakpoint is set, code execution can be triggered by interacting with the page or calling a function from the console. When the breakpoint is hit, the debugger pauses execution, enabling the inspection of the code's current state.
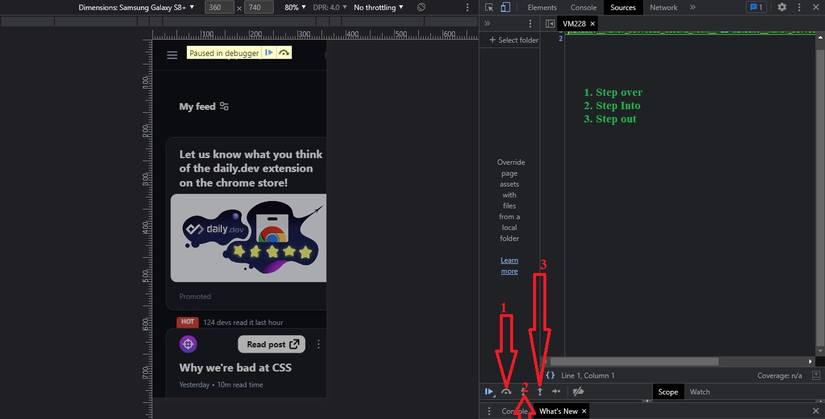
By using the step over, step into, and step out buttons, you can navigate through the code while inspecting variable and expression values.
3. Use the JavaScript debugger Statement
In addition to breakpoints, you can leverage the JavaScript debugger statement to pause code execution and initiate the browser debugger.
This powerful statement can be inserted at any desired location within the code. Upon execution, it promptly suspends code execution and launches the browser debugger.
The JavaScript debugger statement provides you with a convenient way to examine and debug your code in real time. By strategically placing the debugger statement at specific points within the code, you can effectively inspect the program's state, variables, and potential issues that may arise during execution.
The debugger provides an interactive environment where you can step through the code line by line, inspect variable values, evaluate expressions, and identify and rectify logical or runtime errors.
Leveraging this debugging feature offers valuable insights into the inner workings of the code, facilitating performance and functionality improvements.
function add(a, b) {
 debugger;
 const result = a + b;
 return result;
}
When the code hits the debugger statement, the browser debugger launches, allowing inspection of the code's current state and stepping through it as necessary.
4. Utilize Error Messages for Bug Identification
JavaScript is notorious for its cryptic error messages, but these messages often provide valuable clues about code bugs. When encountering an error message, it is crucial to read it carefully and strive to understand its meaning.
For example, consider a function that takes an object as an argument and returns one of its properties:
function getProperty(obj, prop) {
 return obj[prop];
}
If this function is called with an undefined object, an error message like the following will be displayed:
getProperty(undefined, "name");
// Output: Uncaught TypeError: Cannot read property 'name' of undefined
This error message indicates an attempt to access the property "name" of an undefined object, which is not allowed. By reading the error message and examining the code, the problem can be quickly identified and resolved:
function getProperty(obj, prop) {
 if (!obj) {
 console.error("Object is undefined!");
 return;
 }
 return obj[prop];
}
Now, when calling the function with an undefined object, a helpful error message will be displayed in the browser console, and the function will gracefully exit without crashing the page.
5. Employ Browser Extensions and Tools
When it comes to enhancing your debugging experience for JavaScript code, a multitude of browser extensions and tools are at your disposal. These tools offer a wide array of features and functionalities to make your debugging sessions more efficient and effective.
Below are some of the popular ones:
Chrome DevTools and Firefox Developer Tools
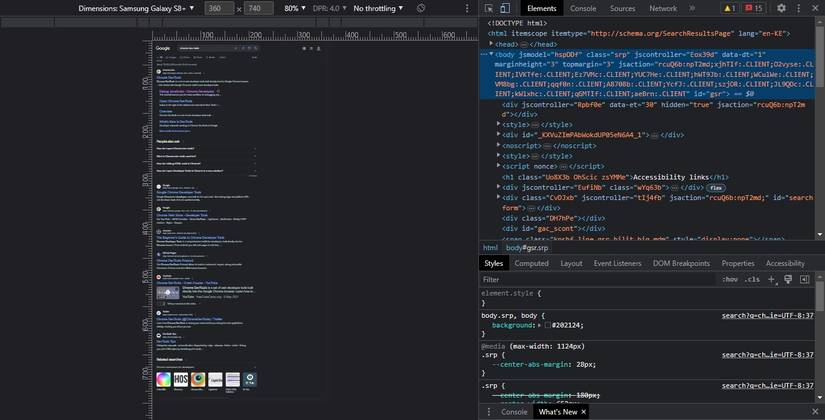
You can use Chrome DevTools, an embedded debugger and developer toolset that accompanies the Google Chrome browser.
It boasts an extensive range of capabilities, including breakpoints for pausing code execution, step-by-step debugging to analyze code flow, console logging for real-time feedback, network analysis for optimizing performance, and much more. With Chrome DevTools, you have a comprehensive toolkit at your fingertips.
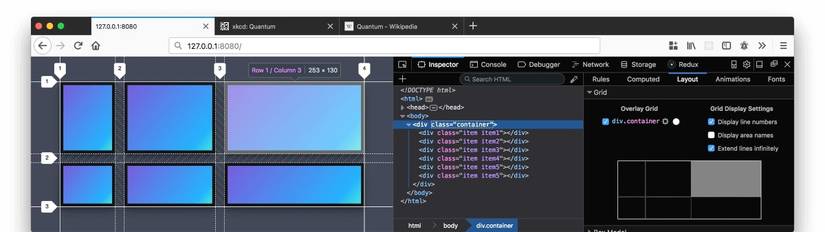
https://www.mozilla.org/en-US/firefox/developer/
For Firefox users, Firefox Developer Tools serves as the equivalent counterpart. It offers similar features and functionality, providing a seamless debugging experience within the Firefox browser. Just like Chrome DevTools, it empowers you to diagnose and resolve issues efficiently.
VS Code
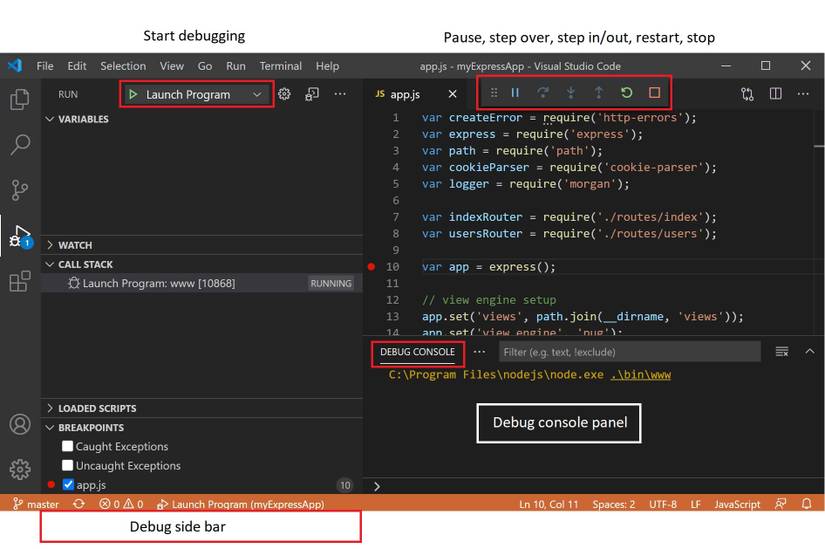
https://code.visualstudio.com/docs/editor/debugging
If you prefer a code editor that integrates debugging capabilities, you can set up VS Code on your PC. Apart from being a versatile code editor, it comes equipped with a built-in debugger for JavaScript and various other programming languages.
With VS Code, you can leverage many of the same debugging features found in browser-specific tools, all within a streamlined and cohesive workflow.
React Developer Tools
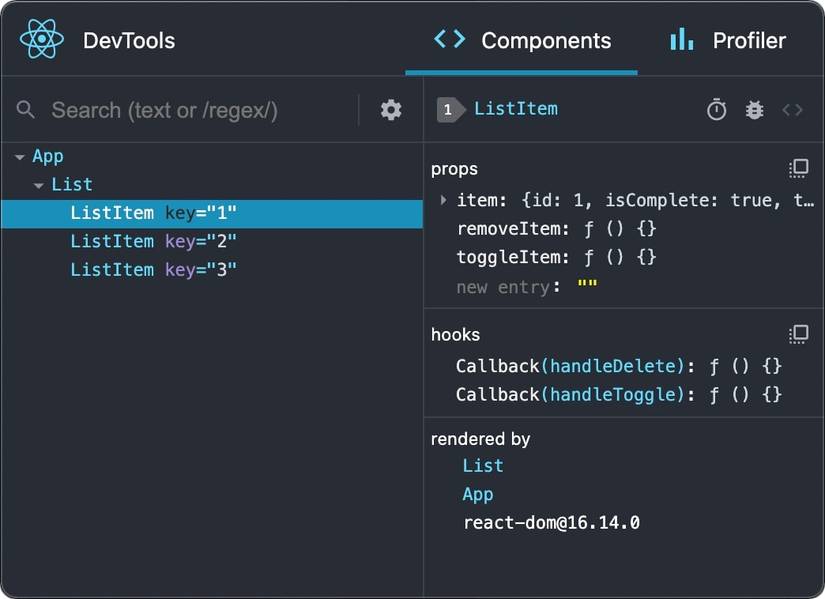
https://react.dev/learn/react-developer-tools
For developers working with React applications, the React Developer Tools browser extension is a valuable asset. This dedicated toolset is designed to cater specifically to debugging React components.
It offers additional tools and insights tailored to the unique challenges faced when working with React.
By incorporating these tools and extensions into your debugging toolkit, you can streamline the process, saving valuable time and minimizing frustration.
The combination of Chrome DevTools, Firefox Developer Tools, VS Code, and React Developer Tools equips you with a diverse set of resources to tackle JavaScript debugging with confidence and finesse.
Optimizing JavaScript Debugging
Debugging JavaScript code can be a challenging and time-consuming endeavor. However, with the application of appropriate strategies and tools, it is possible to enhance efficiency and effectiveness.
By employing console.log() statements, breakpoints, the debugger statement, error messages, and browser extensions and tools, bugs in the code can be quickly identified and isolated, allowing you to resume building exceptional applications.