Debugging your Node.js application in Visual Studio Code itself is possible and straightforward. The VS Code editor comes with a built-in debugger capable of debugging any application that targets the Node.js runtime. This means that you can debug JavaScript or any other language that compiles to it (e.g. TypeScript).
This article will walk you through the steps for debugging your Node.js application in VS Code. You'll learn how to start a debug session, insert breakpoints, attach an external process, and debug TypeScript code using source maps.
What You Need to Get Started
Before you start, install both Node.js and VS Code on your local machine. The latest version of Node.js is available on the Node.js official website. Similarly, for Visual Studio Code, download the latest version from the VS Code website. For instructions on how to set up VS Code on Windows, read our setup guide.
You also need a Node.js project. You can create a simple Node.js application from scratch or use an existing application.
The Debugging Process in VS Code
Starting a debug session in the VS Code editor is pretty straightforward. Open the file with VS Code and click the Run and Debug icon in the sidebar (or press Ctrl + Shift + D on your keyboard). Next, click the Run and Debug button to start the process.
By default, Node.js will try to figure out the debug environment of your project. But if the auto-detection is unsuccessful, it prompts you to select the right environment. For this tutorial, that environment is Node.js.
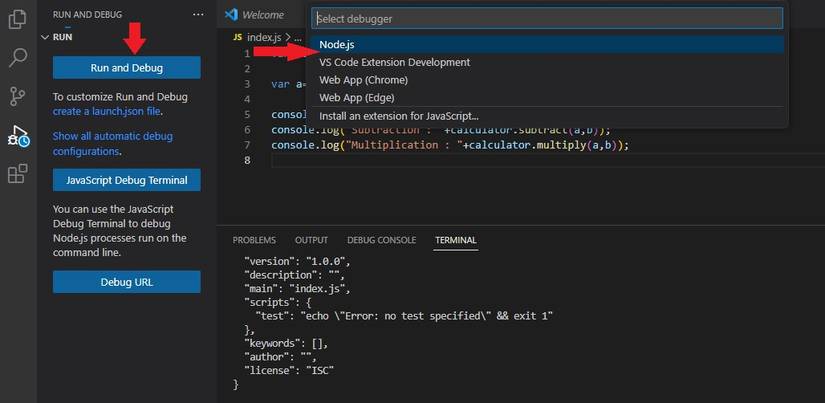
After you have selected the environment, VS Code activates the debugger and attaches it to the process. You can see your output in the DEBUG CONSOLE. Using the debug toolbar at the top, you can iterate through the code, pause execution, or end the session.
You also have the option of creating a configuration file. The launch.json file lets you configure and set up debug details. If your script requires an argument, supply these arguments in the launch.json file. Multiple options can be set on each configuration:
{
 "version": "0.2.0",
 "configurations": [
 { "type": "node",
 "request": "launch",
 "name": "Launch Program",
 "skipFiles": [ "<node_internals>/**" ],
 "program": "${workspaceFolder}\\index.js"
 }
 ]
}
You'll also notice five panels on the left-hand side of the editor. These panels are VARIABLES, WATCH, CALL STACK, LOADED SCRIPTS, and BREAKPOINTS:
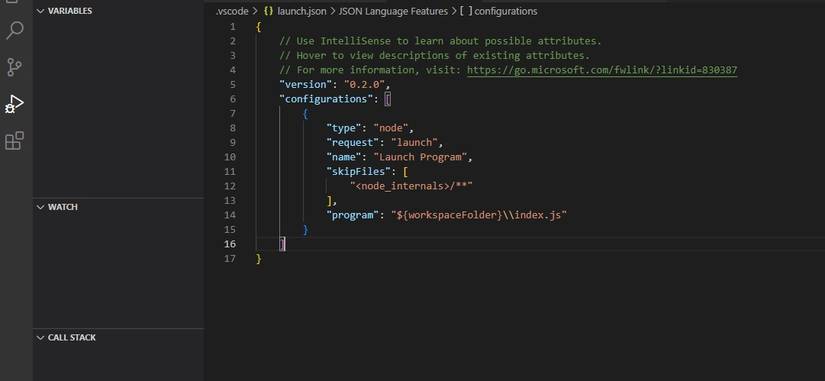
When you're done setting up the configuration, select and execute the program through the configuration menu.
Attach an External Process
Another method for setting up a Node.js debugging session is by attaching an external process. Start the program with the following command:
node --inspect index.js
Insert the -brk flag after --inspect if you want to attach it before the program starts to run.
Next, open the process picker in VS Code. This lists all the processes available in the Node.js environment. To open the picker, press Ctrl + Shift + P and find the Debug: Attach to Node.js command.
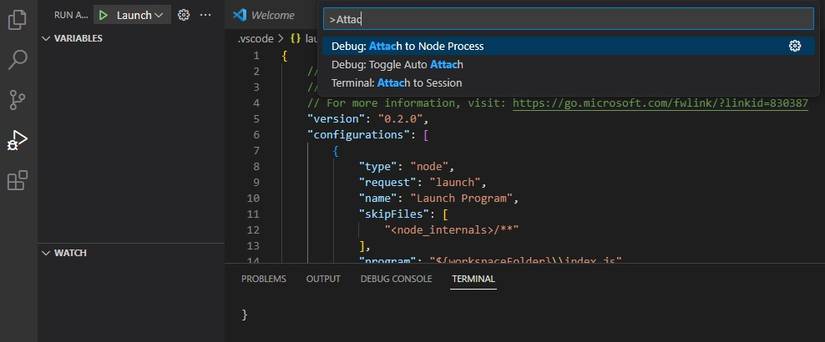
Click on the command and select the right option to start the debug process.
Creating a Breakpoint
If you want to pause at specific points in your program to inspect the code, set breakpoints there. You can set breakpoints almost anywhere in your code. This includes variables declarations, expressions, and comments. But you can't set breakpoints in function declarations.
Creating a breakpoint is pretty straightforward. As you move your mouse to the left side of the line numbers, a red circle appears on each line. Identify the line number in your code where you want to insert the breakpoint. Then click on that line to add the breakpoint:
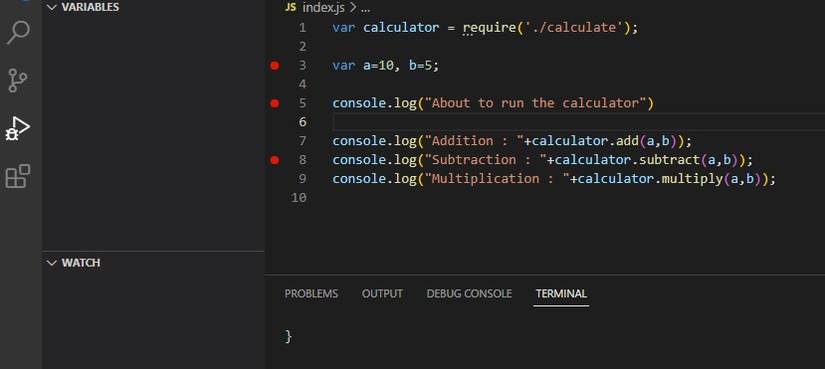
In the BREAKPOINTS pane, you'll find all the breakpoints enabled in your project. This is where you'll manage, edit, and disable breakpoints. You can also halt the code when an exception throws or in cases of uncaught exceptions. This allows you to inspect the problem before the process exits.
Let's see breakpoints in action. Click the Launch icon to start the debugging session. The program will pause at the first breakpoint and yield the value for inspection:
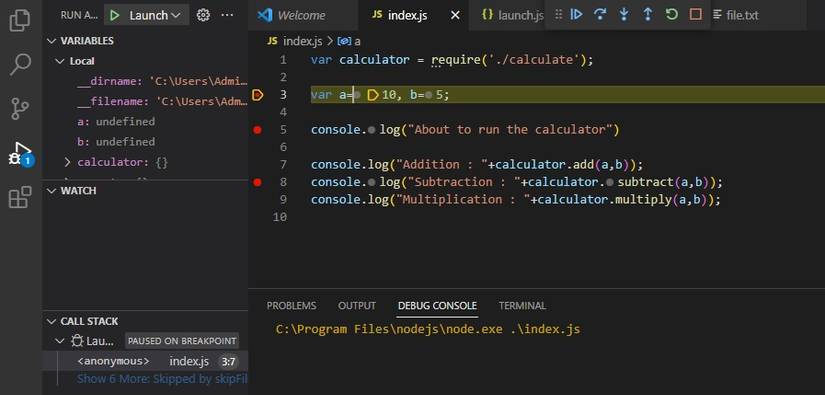
You can click the Continue icon (or press F5) to move the program to the next breakpoint. This will continue until you arrive at the end of the program.
Debugging TypeScript With Source Maps
As Typescript continues to grow more popular, the amount of Node.js projects written in TypeScript is bound to increase. Luckily, you can also debug TypeScript-based projects with VS Code.
First, create a tsconfig.json file in your project's root directory (if it isn't already created) and enable source maps:
{ "compilerOptions": { "sourceMaps": true }}
Next, attach the running process and set the breakpoints in your TypeScript file. Visual Studio Code will find the source maps and use them.
You can explicitly tell VS Code where to find the source maps. To do this, add an outFiles attribute in your launch configuration file and point it to the exact location of your source maps:
{
 "version": "0.2.0",
 "configurations": [ {
 "type": "node",
 "request": "launch",
 "name": "Launch Program",
 "skipFiles": [ "<node_internals>/**" ],
 "program": "${workspaceFolder}\\index.js",
 "outFiles": "${workspaceFolder}\\index.js",
 }
 ]
}
If you’re using ts-node to run your project without a build step, use this instead of the configuration above:
{
 "version": "0.2.0",
 "configurations": [ {
 "type": "pwa-node",
 "request": "launch",
 "name": "Launch Server",
 "skipFiles": [ "<node_internals>/**" ],
 "runtimeArgs": [ "-r", "ts-node/register" ],
 "args": [ "${workspaceFolder}/src/server.ts" ]
 }]
}
Since there is no program attribute, runtime args registers ts-node as the handler for TypeScript files. The first argument to args is the entry file for the program. Now you can start your debugging session. If you're developing with vanilla JavaScript or a front-end framework, you can also debug the JavaScript code in the browser.
Other Features in Visual Studio Code
Visual Studio Code is a powerful source code editor packed with amazing features. We covered VS Code's built-in debugger tool. We also demonstrated how you can use it to debug your Node.js application.
But there are a lot of other handy features in VS Code. While you might be familiar with some of them, some might be completely new to you. In that case, it might interest you to learn about these features and how to use them.