You can subscribe to this list here.
| 2003 |
Jan
|
Feb
|
Mar
|
Apr
|
May
|
Jun
|
Jul
|
Aug
|
Sep
|
Oct
(1) |
Nov
(33) |
Dec
(20) |
|---|---|---|---|---|---|---|---|---|---|---|---|---|
| 2004 |
Jan
(7) |
Feb
(44) |
Mar
(51) |
Apr
(43) |
May
(43) |
Jun
(36) |
Jul
(61) |
Aug
(44) |
Sep
(25) |
Oct
(82) |
Nov
(97) |
Dec
(47) |
| 2005 |
Jan
(77) |
Feb
(143) |
Mar
(42) |
Apr
(31) |
May
(93) |
Jun
(93) |
Jul
(35) |
Aug
(78) |
Sep
(56) |
Oct
(44) |
Nov
(72) |
Dec
(75) |
| 2006 |
Jan
(116) |
Feb
(99) |
Mar
(181) |
Apr
(171) |
May
(112) |
Jun
(86) |
Jul
(91) |
Aug
(111) |
Sep
(77) |
Oct
(72) |
Nov
(57) |
Dec
(51) |
| 2007 |
Jan
(64) |
Feb
(116) |
Mar
(70) |
Apr
(74) |
May
(53) |
Jun
(40) |
Jul
(519) |
Aug
(151) |
Sep
(132) |
Oct
(74) |
Nov
(282) |
Dec
(190) |
| 2008 |
Jan
(141) |
Feb
(67) |
Mar
(69) |
Apr
(96) |
May
(227) |
Jun
(404) |
Jul
(399) |
Aug
(96) |
Sep
(120) |
Oct
(205) |
Nov
(126) |
Dec
(261) |
| 2009 |
Jan
(136) |
Feb
(136) |
Mar
(119) |
Apr
(124) |
May
(155) |
Jun
(98) |
Jul
(136) |
Aug
(292) |
Sep
(174) |
Oct
(126) |
Nov
(126) |
Dec
(79) |
| 2010 |
Jan
(109) |
Feb
(83) |
Mar
(139) |
Apr
(91) |
May
(79) |
Jun
(164) |
Jul
(184) |
Aug
(146) |
Sep
(163) |
Oct
(128) |
Nov
(70) |
Dec
(73) |
| 2011 |
Jan
(235) |
Feb
(165) |
Mar
(147) |
Apr
(86) |
May
(74) |
Jun
(118) |
Jul
(65) |
Aug
(75) |
Sep
(162) |
Oct
(94) |
Nov
(48) |
Dec
(44) |
| 2012 |
Jan
(49) |
Feb
(40) |
Mar
(88) |
Apr
(35) |
May
(52) |
Jun
(69) |
Jul
(90) |
Aug
(123) |
Sep
(112) |
Oct
(120) |
Nov
(105) |
Dec
(116) |
| 2013 |
Jan
(76) |
Feb
(26) |
Mar
(78) |
Apr
(43) |
May
(61) |
Jun
(53) |
Jul
(147) |
Aug
(85) |
Sep
(83) |
Oct
(122) |
Nov
(18) |
Dec
(27) |
| 2014 |
Jan
(58) |
Feb
(25) |
Mar
(49) |
Apr
(17) |
May
(29) |
Jun
(39) |
Jul
(53) |
Aug
(52) |
Sep
(35) |
Oct
(47) |
Nov
(110) |
Dec
(27) |
| 2015 |
Jan
(50) |
Feb
(93) |
Mar
(96) |
Apr
(30) |
May
(55) |
Jun
(83) |
Jul
(44) |
Aug
(8) |
Sep
(5) |
Oct
|
Nov
(1) |
Dec
(1) |
| 2016 |
Jan
|
Feb
|
Mar
(1) |
Apr
|
May
|
Jun
(2) |
Jul
|
Aug
(3) |
Sep
(1) |
Oct
(3) |
Nov
|
Dec
|
| 2017 |
Jan
|
Feb
(5) |
Mar
|
Apr
|
May
|
Jun
|
Jul
(3) |
Aug
|
Sep
(7) |
Oct
|
Nov
|
Dec
|
| 2018 |
Jan
|
Feb
|
Mar
|
Apr
|
May
|
Jun
|
Jul
(2) |
Aug
|
Sep
|
Oct
|
Nov
|
Dec
|
| S | M | T | W | T | F | S |
|---|---|---|---|---|---|---|
|
|
|
|
1
(2) |
2
(5) |
3
(2) |
4
(3) |
|
5
|
6
(3) |
7
(1) |
8
|
9
|
10
|
11
|
|
12
(1) |
13
(2) |
14
(4) |
15
(1) |
16
|
17
|
18
|
|
19
|
20
|
21
(1) |
22
(4) |
23
(1) |
24
(5) |
25
(1) |
|
26
(1) |
27
|
28
|
29
(1) |
30
|
31
(6) |
|
Although I agree with Phillip that voting was not super-principled, I also
agree with you Tom that it's time to move on. All the above colormaps meet
stringent perceptibility criteria and so the vote comes down mostly to
aesthetics. As long as they are all named options, I for one will be happy.
Thank you everyone and especially Nathaniel for the amazing work on this
topic!
On Mon, Jul 13, 2015 at 10:19 AM, Thomas Caswell <tca...@gm...> wrote:
>
> See around https://youtu.be/xAoljeRJ3lU?t=1010 for the break down in the
> voting.
>
> All four of the color maps will be included in 1.5 your default is
> configurable via matplotlibrc, `rcParams` or `mpl.style.use`.
>
> I do not think further (meta-)discussion of the new default color map is
> productive.
>
> Tom
>
> Note: I have trimmed the
>
> On Mon, Jul 13, 2015 at 4:54 AM Philipp A. <fly...@we...> wrote:
>
>> Thomas Caswell <tca...@gm...> schrieb am So., 12. Juli 2015 um
>> 18:21 Uhr:
>>
>>> The new default color map will be 'viridis' (aka option D).
>>>
>>
>> hi,
>>
>> how did you get to that decision?
>>
>> from at cursory glance at the opinions thread there didn’t seem to be a
>> majority for option D as opposed to A, B, and C.
>>
>> A, B, and C were variations on a theme, so a fair vote would be ABC or D,
>> and then if applicable a second one to decide which variation of ABC to use.
>>
>> best, philipp
>>
>
>
> ------------------------------------------------------------------------------
> Don't Limit Your Business. Reach for the Cloud.
> GigeNET's Cloud Solutions provide you with the tools and support that
> you need to offload your IT needs and focus on growing your business.
> Configured For All Businesses. Start Your Cloud Today.
> https://www.gigenetcloud.com/
> _______________________________________________
> Matplotlib-devel mailing list
> Mat...@li...
> https://lists.sourceforge.net/lists/listinfo/matplotlib-devel
>
>
See around https://youtu.be/xAoljeRJ3lU?t=1010 for the break down in the
voting.
All four of the color maps will be included in 1.5 your default is
configurable via matplotlibrc, `rcParams` or `mpl.style.use`.
I do not think further (meta-)discussion of the new default color map is
productive.
Tom
Note: I have trimmed the
On Mon, Jul 13, 2015 at 4:54 AM Philipp A. <fly...@we...> wrote:
> Thomas Caswell <tca...@gm...> schrieb am So., 12. Juli 2015 um
> 18:21 Uhr:
>
>> The new default color map will be 'viridis' (aka option D).
>>
>
> hi,
>
> how did you get to that decision?
>
> from at cursory glance at the opinions thread there didn’t seem to be a
> majority for option D as opposed to A, B, and C.
>
> A, B, and C were variations on a theme, so a fair vote would be ABC or D,
> and then if applicable a second one to decide which variation of ABC to use.
>
> best, philipp
>
Hello all,
Following much discussion, we are changing the default color map and styles
in the upcoming 2.0 release!
The new default color map will be 'viridis' (aka option D). I recommend
everyone watch Nathaniel Smith and Stéfan van der Walt's talk from
SciPy2015 introducing the new color map and providing an introduction to
the math of color perception: https://www.youtube.com/watch?v=xAoljeRJ3lU
We are soliciting proposals to change any and all other visual defaults
(including adding new rcParams as needed).
If you have a proposal please create a PR or issue with the changes to
`rcsetup.py` and `matplotlibrc.template` implementing the changes by August
9, 2015 (1 month from now). Do not worry about updating any failing tests.
At the end, Micheal Droettboom and I will decide on the new defaults.
A 'classic' style will be provided so reverting to the current default
values will be a single line of python (`mpl.style.use('classic')`).
Please distribute this as widely as possible. We only want to do this once
and want to get feedback from as many users as possible.
Thomas Caswell
PS jet is harmful to you and those around you
See https://github.com/matplotlib/matplotlib/pull/4622 for an example
proposal PR.
Thanks Eric! A bunch of us will be at SciPy this week and it would be
great to talk more about this stuff with the mpl devs that are around.
Cheers,
Brian
On Mon, Jul 6, 2015 at 12:18 PM, Eric Firing <ef...@ha...> wrote:
> There is a long thread on IPython-dev discussing how to make matplotlib
> "just work" in a notebook without requiring "%matplotlib inline" or any
> other such magic at the top. As a side topic in the thread, there are
> comments as to how useful "%pylab" still is for real work.
>
> http://article.gmane.org/gmane.comp.python.ipython.devel/15434
>
> Eric
>
> ------------------------------------------------------------------------------
> Don't Limit Your Business. Reach for the Cloud.
> GigeNET's Cloud Solutions provide you with the tools and support that
> you need to offload your IT needs and focus on growing your business.
> Configured For All Businesses. Start Your Cloud Today.
> https://www.gigenetcloud.com/
> _______________________________________________
> Matplotlib-devel mailing list
> Mat...@li...
> https://lists.sourceforge.net/lists/listinfo/matplotlib-devel
--
Brian E. Granger
Cal Poly State University, San Luis Obispo
@ellisonbg on Twitter and GitHub
bgr...@ca... and ell...@gm...
For what it is worth, if D were made the default colormap, I would be very
happy.
On 1 July 2015 at 22:35, Thomas Caswell <tca...@gm...> wrote:
> We would like to tag 1.5 around scipy and it would be nice to get the new
> color maps out, even if they are not yet the default.
>
> On Wed, Jul 1, 2015, 11:13 PM Nathaniel Smith <nj...@po...> wrote:
>
>> On Jul 1, 2015 6:31 PM, "Eric Firing" <ef...@ha...> wrote:
>> >
>> > On 2015年07月01日 1:56 PM, Nathaniel Smith wrote:
>> > > On Tue, Jun 16, 2015 at 7:14 PM, Nathaniel Smith <nj...@po...>
>> wrote:
>> > >
>> > > [...snip discussion of how option D was the favorite of 80% of people
>> > > in the survey...]
>> > >
>> > >> So the next question is where we go from here.
>> >
>> > One thing we need to do is get some of these maps into _cm.py via PR.
>>
>> We've been a bit distracted getting the software and talk together ahead
>> of scipy, but PR (with names) will follow within the next week or so. The
>> decision part is pretty orthogonal though I think? It's not like matplotlib
>> 2.0 is going to branch between now and scipy :-).
>>
>> > I would prefer not to have them go in as huge tables if they can be made
>> > more compact, either by being function-generated or by using the
>> > LinearSegmentedColormap mechanism with a moderate number of breakpoints.
>> >
>> > Suggestions?
>>
>> Depends on how you define "moderate", but my guess is that linear
>> segmented is the best approach -- the exact colormaps have a pretty terse
>> representation as bezier control points, but using this at runtime would
>> require pulling in the full colorspace apparatus as a dependency. Which I
>> guess has points in its favor for other reasons, but nonetheless.
>>
>> These kinds of details can be worked out in the PR review process,
>> though. The blocking issue is that we need a decision :-).
>>
>> -n
>>
>> ------------------------------------------------------------------------------
>> Don't Limit Your Business. Reach for the Cloud.
>> GigeNET's Cloud Solutions provide you with the tools and support that
>> you need to offload your IT needs and focus on growing your business.
>> Configured For All Businesses. Start Your Cloud Today.
>> https://www.gigenetcloud.com/
>> _______________________________________________
>> Matplotlib-devel mailing list
>> Mat...@li...
>> https://lists.sourceforge.net/lists/listinfo/matplotlib-devel
>>
>
>
> ------------------------------------------------------------------------------
> Don't Limit Your Business. Reach for the Cloud.
> GigeNET's Cloud Solutions provide you with the tools and support that
> you need to offload your IT needs and focus on growing your business.
> Configured For All Businesses. Start Your Cloud Today.
> https://www.gigenetcloud.com/
> _______________________________________________
> Matplotlib-devel mailing list
> Mat...@li...
> https://lists.sourceforge.net/lists/listinfo/matplotlib-devel
>
>
Hi Tom,
tried to understand the internals of matplotlib during the weekend.
Sorry, cound not figure out how matloblib works and where to catch the
exceptions.
It would be appreciated if someone of the dev group could add the
special cases handling.
Elmar
On 04.07.2015 15:23, Thomas Caswell wrote:
> Yes, that seems reasonable. @elmar you seem to have a pretty good grasp
> of the code and the use case, would you mind taking a crack at adding
> those special cases?
>
> Tom
>
> On Sat, Jul 4, 2015 at 8:58 AM elmar werling <el...@ne...
> <mailto:el...@ne...>> wrote:
>
> having a look at seaborns ViolinPlotter class
> (https://github.com/mwaskom/seaborn/blob/master/seaborn/categorical.py),
> they explicit handle the special case of "no data" and "single unique
> datapoint" at line 580 ff.
>
> Could something similar be added to matplotlibs violinplot?
>
> On 04.07.2015 12:28, elmar werling wrote:
> > from an end user point of view, matplotlibs violinplot should just do
> > the same as seaborns violinplot.
> >
> >
> > #####################################################################
> > import numpy as np
> > import matplotlib.pyplot as plt
> > import seaborn as sns
> >
> > N = 100
> > y1 = np.random.randn(N) + 3.0
> > y2 = np.random.randn(N) * 5.0 + 50
> > y3 = np.ones(N) * 100 # causing plt.violinplot problem
> > y4 = np.arange(0) # causing plt.violinplot problem
> >
> > #plt.violinplot([y1, y2, y3, y4])
> >
> > sns.violinplot(data=[y1, y2, y3, y4])
> >
> >
> > On 03.07.2015 17:52, Thomas Caswell wrote:
> >> The KDE computation code is a copy of the KDE code from scipy
> >> (https://github.com/scipy/scipy/blob/master/scipy/stats/kde.py), I
> >> suggest raising this issue on their mailing list/github.
> >>
> >> I strongly suspect that violin plot should be doing data
> sanitation on
> >> the way in or catching exceptions like this, but I am not familiar
> >> enough with the math to be sure what it should do instead.
> >>
> >> Tom
> >>
> >> On Fri, Jul 3, 2015 at 11:41 AM elmar werling
> >> <el...@ne...
> <mailto:el...@ne...>
> >> <mailto:el...@ne...
> <mailto:el...@ne...>>> wrote:
> >>
> >>
> >> Hi all,
> >>
> >> violinplot is crashing with singular matrix data. See example.
> >>
> >> Is this behaviour for a singular matrix intended or just a bug?
> >>
> >> Cheers
> >> Elmar
> >>
> >>
> >>
> >> #####################################################
> >> import numpy as np
> >> import matplotlib.pyplot as plt
> >>
> >> # data mimicing the
> >> # original cumsum data (may sum up to 100)
> >> N = 100
> >> y1 = np.random.randn(N) + 3.0
> >> y2 = np.random.randn(N) * 5.0 + 50
> >> y3 = np.ones(N) * 100 # data set causing violinplot problem
> >>
> >> plt.violinplot([y1, y2, y3])
> >>
> >> plt.boxplot([y1, y2, y3]) # ok
> >> plt.ylim(0,110)
> >>
> >> #####################################################
> >>
> >> OS: Debian
> >> Anaconda 2.3.0 (64-bit)
> >> Python 2.7.10
> >> numpy 2.3.0
> >> matplotlib 1.4.3
> >>
> >>
> >>
> ------------------------------------------------------------------------------
> >> Don't Limit Your Business. Reach for the Cloud.
> >> GigeNET's Cloud Solutions provide you with the tools and
> support that
> >> you need to offload your IT needs and focus on growing your
> business.
> >> Configured For All Businesses. Start Your Cloud Today.
> >> https://www.gigenetcloud.com/
> >> _______________________________________________
> >> Matplotlib-devel mailing list
> >>
> Mat...@li...
> <mailto:Mat...@li...>
> >>
> <mailto:Mat...@li...
> <mailto:Mat...@li...>>
> >> https://lists.sourceforge.net/lists/listinfo/matplotlib-devel
> >>
> >>
> >>
> >>
> ------------------------------------------------------------------------------
> >> Don't Limit Your Business. Reach for the Cloud.
> >> GigeNET's Cloud Solutions provide you with the tools and support
> that
> >> you need to offload your IT needs and focus on growing your
> business.
> >> Configured For All Businesses. Start Your Cloud Today.
> >> https://www.gigenetcloud.com/
> >>
> >>
> >>
> >> _______________________________________________
> >> Matplotlib-devel mailing list
> >>
> Mat...@li...
> <mailto:Mat...@li...>
> >> https://lists.sourceforge.net/lists/listinfo/matplotlib-devel
> >>
> >
> >
> >
> ------------------------------------------------------------------------------
> > Don't Limit Your Business. Reach for the Cloud.
> > GigeNET's Cloud Solutions provide you with the tools and support that
> > you need to offload your IT needs and focus on growing your business.
> > Configured For All Businesses. Start Your Cloud Today.
> > https://www.gigenetcloud.com/
> >
>
>
> ------------------------------------------------------------------------------
> Don't Limit Your Business. Reach for the Cloud.
> GigeNET's Cloud Solutions provide you with the tools and support that
> you need to offload your IT needs and focus on growing your business.
> Configured For All Businesses. Start Your Cloud Today.
> https://www.gigenetcloud.com/
> _______________________________________________
> Matplotlib-devel mailing list
> Mat...@li...
> <mailto:Mat...@li...>
> https://lists.sourceforge.net/lists/listinfo/matplotlib-devel
>
>
>
> ------------------------------------------------------------------------------
> Don't Limit Your Business. Reach for the Cloud.
> GigeNET's Cloud Solutions provide you with the tools and support that
> you need to offload your IT needs and focus on growing your business.
> Configured For All Businesses. Start Your Cloud Today.
> https://www.gigenetcloud.com/
>
>
>
> _______________________________________________
> Matplotlib-devel mailing list
> Mat...@li...
> https://lists.sourceforge.net/lists/listinfo/matplotlib-devel
>
There is a long thread on IPython-dev discussing how to make matplotlib
"just work" in a notebook without requiring "%matplotlib inline" or any
other such magic at the top. As a side topic in the thread, there are
comments as to how useful "%pylab" still is for real work.
http://article.gmane.org/gmane.comp.python.ipython.devel/15434
Eric
Yes, that seems reasonable. @elmar you seem to have a pretty good grasp of
the code and the use case, would you mind taking a crack at adding those
special cases?
Tom
On Sat, Jul 4, 2015 at 8:58 AM elmar werling <el...@ne...> wrote:
> having a look at seaborns ViolinPlotter class
> (https://github.com/mwaskom/seaborn/blob/master/seaborn/categorical.py),
> they explicit handle the special case of "no data" and "single unique
> datapoint" at line 580 ff.
>
> Could something similar be added to matplotlibs violinplot?
>
> On 04.07.2015 12:28, elmar werling wrote:
> > from an end user point of view, matplotlibs violinplot should just do
> > the same as seaborns violinplot.
> >
> >
> > #####################################################################
> > import numpy as np
> > import matplotlib.pyplot as plt
> > import seaborn as sns
> >
> > N = 100
> > y1 = np.random.randn(N) + 3.0
> > y2 = np.random.randn(N) * 5.0 + 50
> > y3 = np.ones(N) * 100 # causing plt.violinplot problem
> > y4 = np.arange(0) # causing plt.violinplot problem
> >
> > #plt.violinplot([y1, y2, y3, y4])
> >
> > sns.violinplot(data=[y1, y2, y3, y4])
> >
> >
> > On 03.07.2015 17:52, Thomas Caswell wrote:
> >> The KDE computation code is a copy of the KDE code from scipy
> >> (https://github.com/scipy/scipy/blob/master/scipy/stats/kde.py), I
> >> suggest raising this issue on their mailing list/github.
> >>
> >> I strongly suspect that violin plot should be doing data sanitation on
> >> the way in or catching exceptions like this, but I am not familiar
> >> enough with the math to be sure what it should do instead.
> >>
> >> Tom
> >>
> >> On Fri, Jul 3, 2015 at 11:41 AM elmar werling
> >> <el...@ne...
> >> <mailto:el...@ne...>> wrote:
> >>
> >>
> >> Hi all,
> >>
> >> violinplot is crashing with singular matrix data. See example.
> >>
> >> Is this behaviour for a singular matrix intended or just a bug?
> >>
> >> Cheers
> >> Elmar
> >>
> >>
> >>
> >> #####################################################
> >> import numpy as np
> >> import matplotlib.pyplot as plt
> >>
> >> # data mimicing the
> >> # original cumsum data (may sum up to 100)
> >> N = 100
> >> y1 = np.random.randn(N) + 3.0
> >> y2 = np.random.randn(N) * 5.0 + 50
> >> y3 = np.ones(N) * 100 # data set causing violinplot problem
> >>
> >> plt.violinplot([y1, y2, y3])
> >>
> >> plt.boxplot([y1, y2, y3]) # ok
> >> plt.ylim(0,110)
> >>
> >> #####################################################
> >>
> >> OS: Debian
> >> Anaconda 2.3.0 (64-bit)
> >> Python 2.7.10
> >> numpy 2.3.0
> >> matplotlib 1.4.3
> >>
> >>
> >>
> ------------------------------------------------------------------------------
> >> Don't Limit Your Business. Reach for the Cloud.
> >> GigeNET's Cloud Solutions provide you with the tools and support
> that
> >> you need to offload your IT needs and focus on growing your
> business.
> >> Configured For All Businesses. Start Your Cloud Today.
> >> https://www.gigenetcloud.com/
> >> _______________________________________________
> >> Matplotlib-devel mailing list
> >> Mat...@li...
> >> <mailto:Mat...@li...>
> >> https://lists.sourceforge.net/lists/listinfo/matplotlib-devel
> >>
> >>
> >>
> >>
> ------------------------------------------------------------------------------
> >> Don't Limit Your Business. Reach for the Cloud.
> >> GigeNET's Cloud Solutions provide you with the tools and support that
> >> you need to offload your IT needs and focus on growing your business.
> >> Configured For All Businesses. Start Your Cloud Today.
> >> https://www.gigenetcloud.com/
> >>
> >>
> >>
> >> _______________________________________________
> >> Matplotlib-devel mailing list
> >> Mat...@li...
> >> https://lists.sourceforge.net/lists/listinfo/matplotlib-devel
> >>
> >
> >
> >
> ------------------------------------------------------------------------------
> > Don't Limit Your Business. Reach for the Cloud.
> > GigeNET's Cloud Solutions provide you with the tools and support that
> > you need to offload your IT needs and focus on growing your business.
> > Configured For All Businesses. Start Your Cloud Today.
> > https://www.gigenetcloud.com/
> >
>
>
>
> ------------------------------------------------------------------------------
> Don't Limit Your Business. Reach for the Cloud.
> GigeNET's Cloud Solutions provide you with the tools and support that
> you need to offload your IT needs and focus on growing your business.
> Configured For All Businesses. Start Your Cloud Today.
> https://www.gigenetcloud.com/
> _______________________________________________
> Matplotlib-devel mailing list
> Mat...@li...
> https://lists.sourceforge.net/lists/listinfo/matplotlib-devel
>
having a look at seaborns ViolinPlotter class
(https://github.com/mwaskom/seaborn/blob/master/seaborn/categorical.py),
they explicit handle the special case of "no data" and "single unique
datapoint" at line 580 ff.
Could something similar be added to matplotlibs violinplot?
On 04.07.2015 12:28, elmar werling wrote:
> from an end user point of view, matplotlibs violinplot should just do
> the same as seaborns violinplot.
>
>
> #####################################################################
> import numpy as np
> import matplotlib.pyplot as plt
> import seaborn as sns
>
> N = 100
> y1 = np.random.randn(N) + 3.0
> y2 = np.random.randn(N) * 5.0 + 50
> y3 = np.ones(N) * 100 # causing plt.violinplot problem
> y4 = np.arange(0) # causing plt.violinplot problem
>
> #plt.violinplot([y1, y2, y3, y4])
>
> sns.violinplot(data=[y1, y2, y3, y4])
>
>
> On 03.07.2015 17:52, Thomas Caswell wrote:
>> The KDE computation code is a copy of the KDE code from scipy
>> (https://github.com/scipy/scipy/blob/master/scipy/stats/kde.py), I
>> suggest raising this issue on their mailing list/github.
>>
>> I strongly suspect that violin plot should be doing data sanitation on
>> the way in or catching exceptions like this, but I am not familiar
>> enough with the math to be sure what it should do instead.
>>
>> Tom
>>
>> On Fri, Jul 3, 2015 at 11:41 AM elmar werling
>> <el...@ne...
>> <mailto:el...@ne...>> wrote:
>>
>>
>> Hi all,
>>
>> violinplot is crashing with singular matrix data. See example.
>>
>> Is this behaviour for a singular matrix intended or just a bug?
>>
>> Cheers
>> Elmar
>>
>>
>>
>> #####################################################
>> import numpy as np
>> import matplotlib.pyplot as plt
>>
>> # data mimicing the
>> # original cumsum data (may sum up to 100)
>> N = 100
>> y1 = np.random.randn(N) + 3.0
>> y2 = np.random.randn(N) * 5.0 + 50
>> y3 = np.ones(N) * 100 # data set causing violinplot problem
>>
>> plt.violinplot([y1, y2, y3])
>>
>> plt.boxplot([y1, y2, y3]) # ok
>> plt.ylim(0,110)
>>
>> #####################################################
>>
>> OS: Debian
>> Anaconda 2.3.0 (64-bit)
>> Python 2.7.10
>> numpy 2.3.0
>> matplotlib 1.4.3
>>
>>
>> ------------------------------------------------------------------------------
>> Don't Limit Your Business. Reach for the Cloud.
>> GigeNET's Cloud Solutions provide you with the tools and support that
>> you need to offload your IT needs and focus on growing your business.
>> Configured For All Businesses. Start Your Cloud Today.
>> https://www.gigenetcloud.com/
>> _______________________________________________
>> Matplotlib-devel mailing list
>> Mat...@li...
>> <mailto:Mat...@li...>
>> https://lists.sourceforge.net/lists/listinfo/matplotlib-devel
>>
>>
>>
>> ------------------------------------------------------------------------------
>> Don't Limit Your Business. Reach for the Cloud.
>> GigeNET's Cloud Solutions provide you with the tools and support that
>> you need to offload your IT needs and focus on growing your business.
>> Configured For All Businesses. Start Your Cloud Today.
>> https://www.gigenetcloud.com/
>>
>>
>>
>> _______________________________________________
>> Matplotlib-devel mailing list
>> Mat...@li...
>> https://lists.sourceforge.net/lists/listinfo/matplotlib-devel
>>
>
>
> ------------------------------------------------------------------------------
> Don't Limit Your Business. Reach for the Cloud.
> GigeNET's Cloud Solutions provide you with the tools and support that
> you need to offload your IT needs and focus on growing your business.
> Configured For All Businesses. Start Your Cloud Today.
> https://www.gigenetcloud.com/
>
from an end user point of view, matplotlibs violinplot should just do
the same as seaborns violinplot.
#####################################################################
import numpy as np
import matplotlib.pyplot as plt
import seaborn as sns
N = 100
y1 = np.random.randn(N) + 3.0
y2 = np.random.randn(N) * 5.0 + 50
y3 = np.ones(N) * 100 # causing plt.violinplot problem
y4 = np.arange(0) # causing plt.violinplot problem
#plt.violinplot([y1, y2, y3, y4])
sns.violinplot(data=[y1, y2, y3, y4])
On 03.07.2015 17:52, Thomas Caswell wrote:
> The KDE computation code is a copy of the KDE code from scipy
> (https://github.com/scipy/scipy/blob/master/scipy/stats/kde.py), I
> suggest raising this issue on their mailing list/github.
>
> I strongly suspect that violin plot should be doing data sanitation on
> the way in or catching exceptions like this, but I am not familiar
> enough with the math to be sure what it should do instead.
>
> Tom
>
> On Fri, Jul 3, 2015 at 11:41 AM elmar werling
> <el...@ne...
> <mailto:el...@ne...>> wrote:
>
>
> Hi all,
>
> violinplot is crashing with singular matrix data. See example.
>
> Is this behaviour for a singular matrix intended or just a bug?
>
> Cheers
> Elmar
>
>
>
> #####################################################
> import numpy as np
> import matplotlib.pyplot as plt
>
> # data mimicing the
> # original cumsum data (may sum up to 100)
> N = 100
> y1 = np.random.randn(N) + 3.0
> y2 = np.random.randn(N) * 5.0 + 50
> y3 = np.ones(N) * 100 # data set causing violinplot problem
>
> plt.violinplot([y1, y2, y3])
>
> plt.boxplot([y1, y2, y3]) # ok
> plt.ylim(0,110)
>
> #####################################################
>
> OS: Debian
> Anaconda 2.3.0 (64-bit)
> Python 2.7.10
> numpy 2.3.0
> matplotlib 1.4.3
>
>
> ------------------------------------------------------------------------------
> Don't Limit Your Business. Reach for the Cloud.
> GigeNET's Cloud Solutions provide you with the tools and support that
> you need to offload your IT needs and focus on growing your business.
> Configured For All Businesses. Start Your Cloud Today.
> https://www.gigenetcloud.com/
> _______________________________________________
> Matplotlib-devel mailing list
> Mat...@li...
> <mailto:Mat...@li...>
> https://lists.sourceforge.net/lists/listinfo/matplotlib-devel
>
>
>
> ------------------------------------------------------------------------------
> Don't Limit Your Business. Reach for the Cloud.
> GigeNET's Cloud Solutions provide you with the tools and support that
> you need to offload your IT needs and focus on growing your business.
> Configured For All Businesses. Start Your Cloud Today.
> https://www.gigenetcloud.com/
>
>
>
> _______________________________________________
> Matplotlib-devel mailing list
> Mat...@li...
> https://lists.sourceforge.net/lists/listinfo/matplotlib-devel
>
The KDE computation code is a copy of the KDE code from scipy (
https://github.com/scipy/scipy/blob/master/scipy/stats/kde.py), I suggest
raising this issue on their mailing list/github.
I strongly suspect that violin plot should be doing data sanitation on the
way in or catching exceptions like this, but I am not familiar enough with
the math to be sure what it should do instead.
Tom
On Fri, Jul 3, 2015 at 11:41 AM elmar werling <el...@ne...> wrote:
>
> Hi all,
>
> violinplot is crashing with singular matrix data. See example.
>
> Is this behaviour for a singular matrix intended or just a bug?
>
> Cheers
> Elmar
>
>
>
> #####################################################
> import numpy as np
> import matplotlib.pyplot as plt
>
> # data mimicing the
> # original cumsum data (may sum up to 100)
> N = 100
> y1 = np.random.randn(N) + 3.0
> y2 = np.random.randn(N) * 5.0 + 50
> y3 = np.ones(N) * 100 # data set causing violinplot problem
>
> plt.violinplot([y1, y2, y3])
>
> plt.boxplot([y1, y2, y3]) # ok
> plt.ylim(0,110)
>
> #####################################################
>
> OS: Debian
> Anaconda 2.3.0 (64-bit)
> Python 2.7.10
> numpy 2.3.0
> matplotlib 1.4.3
>
>
>
> ------------------------------------------------------------------------------
> Don't Limit Your Business. Reach for the Cloud.
> GigeNET's Cloud Solutions provide you with the tools and support that
> you need to offload your IT needs and focus on growing your business.
> Configured For All Businesses. Start Your Cloud Today.
> https://www.gigenetcloud.com/
> _______________________________________________
> Matplotlib-devel mailing list
> Mat...@li...
> https://lists.sourceforge.net/lists/listinfo/matplotlib-devel
>
Hi all,
violinplot is crashing with singular matrix data. See example.
Is this behaviour for a singular matrix intended or just a bug?
Cheers
Elmar
#####################################################
import numpy as np
import matplotlib.pyplot as plt
# data mimicing the
# original cumsum data (may sum up to 100)
N = 100
y1 = np.random.randn(N) + 3.0
y2 = np.random.randn(N) * 5.0 + 50
y3 = np.ones(N) * 100 # data set causing violinplot problem
plt.violinplot([y1, y2, y3])
plt.boxplot([y1, y2, y3]) # ok
plt.ylim(0,110)
#####################################################
OS:	Debian
Anaconda 2.3.0 (64-bit)
Python 2.7.10
numpy 2.3.0
matplotlib 1.4.3
We would like to tag 1.5 around scipy and it would be nice to get the new
color maps out, even if they are not yet the default.
On Wed, Jul 1, 2015, 11:13 PM Nathaniel Smith <nj...@po...> wrote:
> On Jul 1, 2015 6:31 PM, "Eric Firing" <ef...@ha...> wrote:
> >
> > On 2015年07月01日 1:56 PM, Nathaniel Smith wrote:
> > > On Tue, Jun 16, 2015 at 7:14 PM, Nathaniel Smith <nj...@po...>
> wrote:
> > >
> > > [...snip discussion of how option D was the favorite of 80% of people
> > > in the survey...]
> > >
> > >> So the next question is where we go from here.
> >
> > One thing we need to do is get some of these maps into _cm.py via PR.
>
> We've been a bit distracted getting the software and talk together ahead
> of scipy, but PR (with names) will follow within the next week or so. The
> decision part is pretty orthogonal though I think? It's not like matplotlib
> 2.0 is going to branch between now and scipy :-).
>
> > I would prefer not to have them go in as huge tables if they can be made
> > more compact, either by being function-generated or by using the
> > LinearSegmentedColormap mechanism with a moderate number of breakpoints.
> >
> > Suggestions?
>
> Depends on how you define "moderate", but my guess is that linear
> segmented is the best approach -- the exact colormaps have a pretty terse
> representation as bezier control points, but using this at runtime would
> require pulling in the full colorspace apparatus as a dependency. Which I
> guess has points in its favor for other reasons, but nonetheless.
>
> These kinds of details can be worked out in the PR review process, though.
> The blocking issue is that we need a decision :-).
>
> -n
>
> ------------------------------------------------------------------------------
> Don't Limit Your Business. Reach for the Cloud.
> GigeNET's Cloud Solutions provide you with the tools and support that
> you need to offload your IT needs and focus on growing your business.
> Configured For All Businesses. Start Your Cloud Today.
> https://www.gigenetcloud.com/
> _______________________________________________
> Matplotlib-devel mailing list
> Mat...@li...
> https://lists.sourceforge.net/lists/listinfo/matplotlib-devel
>
On Jul 1, 2015 6:31 PM, "Eric Firing" <ef...@ha...> wrote:
>
> On 2015年07月01日 1:56 PM, Nathaniel Smith wrote:
> > On Tue, Jun 16, 2015 at 7:14 PM, Nathaniel Smith <nj...@po...> wrote:
> >
> > [...snip discussion of how option D was the favorite of 80% of people
> > in the survey...]
> >
> >> So the next question is where we go from here.
>
> One thing we need to do is get some of these maps into _cm.py via PR.
We've been a bit distracted getting the software and talk together ahead of
scipy, but PR (with names) will follow within the next week or so. The
decision part is pretty orthogonal though I think? It's not like matplotlib
2.0 is going to branch between now and scipy :-).
> I would prefer not to have them go in as huge tables if they can be made
> more compact, either by being function-generated or by using the
> LinearSegmentedColormap mechanism with a moderate number of breakpoints.
>
> Suggestions?
Depends on how you define "moderate", but my guess is that linear segmented
is the best approach -- the exact colormaps have a pretty terse
representation as bezier control points, but using this at runtime would
require pulling in the full colorspace apparatus as a dependency. Which I
guess has points in its favor for other reasons, but nonetheless.
These kinds of details can be worked out in the PR review process, though.
The blocking issue is that we need a decision :-).
-n
Not my cup of tea, but to get the ball rolling, how about "Truncated Rainbow"? [Red, Orange, Yellow, Green, Blue, Indigo, Violet][2:]
 From: Benjamin Root <ben...@ou...>
 To: Eric Firing <ef...@ha...>
Cc: matplotlib development list <mat...@li...>
 Sent: Thursday, 2 July 2015, 4:19
 Subject: Re: [matplotlib-devel] Colormap survey results

I have been thinking a bit about naming. We could always go the route of "Heinz 57", "Chanel No. 5", or "Preparation H". Not saying that "MPL-d" is a catchy name or not, but.. :-P
Ben Root
On Wed, Jul 1, 2015 at 9:31 PM, Eric Firing <ef...@ha...> wrote:
On 2015年07月01日 1:56 PM, Nathaniel Smith wrote:
> On Tue, Jun 16, 2015 at 7:14 PM, Nathaniel Smith <nj...@po...> wrote:
>
> [...snip discussion of how option D was the favorite of 80% of people
> in the survey...]
>
>> So the next question is where we go from here.
One thing we need to do is get some of these maps into _cm.py via PR.
I would prefer not to have them go in as huge tables if they can be made
more compact, either by being function-generated or by using the
LinearSegmentedColormap mechanism with a moderate number of breakpoints.
Suggestions?
(We will also need a naming scheme.)
Eric
------------------------------------------------------------------------------
Don't Limit Your Business. Reach for the Cloud.
GigeNET's Cloud Solutions provide you with the tools and support that
you need to offload your IT needs and focus on growing your business.
Configured For All Businesses. Start Your Cloud Today.
https://www.gigenetcloud.com/
_______________________________________________
Matplotlib-devel mailing list
Mat...@li...
https://lists.sourceforge.net/lists/listinfo/matplotlib-devel
I have been thinking a bit about naming. We could always go the route of
"Heinz 57", "Chanel No. 5", or "Preparation H". Not saying that "MPL-d" is
a catchy name or not, but.. :-P
Ben Root
On Wed, Jul 1, 2015 at 9:31 PM, Eric Firing <ef...@ha...> wrote:
> On 2015年07月01日 1:56 PM, Nathaniel Smith wrote:
> > On Tue, Jun 16, 2015 at 7:14 PM, Nathaniel Smith <nj...@po...> wrote:
> >
> > [...snip discussion of how option D was the favorite of 80% of people
> > in the survey...]
> >
> >> So the next question is where we go from here.
>
> One thing we need to do is get some of these maps into _cm.py via PR.
> I would prefer not to have them go in as huge tables if they can be made
> more compact, either by being function-generated or by using the
> LinearSegmentedColormap mechanism with a moderate number of breakpoints.
>
> Suggestions?
>
> (We will also need a naming scheme.)
>
> Eric
>
>
>
> ------------------------------------------------------------------------------
> Don't Limit Your Business. Reach for the Cloud.
> GigeNET's Cloud Solutions provide you with the tools and support that
> you need to offload your IT needs and focus on growing your business.
> Configured For All Businesses. Start Your Cloud Today.
> https://www.gigenetcloud.com/
> _______________________________________________
> Matplotlib-devel mailing list
> Mat...@li...
> https://lists.sourceforge.net/lists/listinfo/matplotlib-devel
>
On 2015年07月01日 1:56 PM, Nathaniel Smith wrote:
> On Tue, Jun 16, 2015 at 7:14 PM, Nathaniel Smith <nj...@po...> wrote:
>
> [...snip discussion of how option D was the favorite of 80% of people
> in the survey...]
>
>> So the next question is where we go from here.
One thing we need to do is get some of these maps into _cm.py via PR.
I would prefer not to have them go in as huge tables if they can be made
more compact, either by being function-generated or by using the
LinearSegmentedColormap mechanism with a moderate number of breakpoints.
Suggestions?
(We will also need a naming scheme.)
Eric
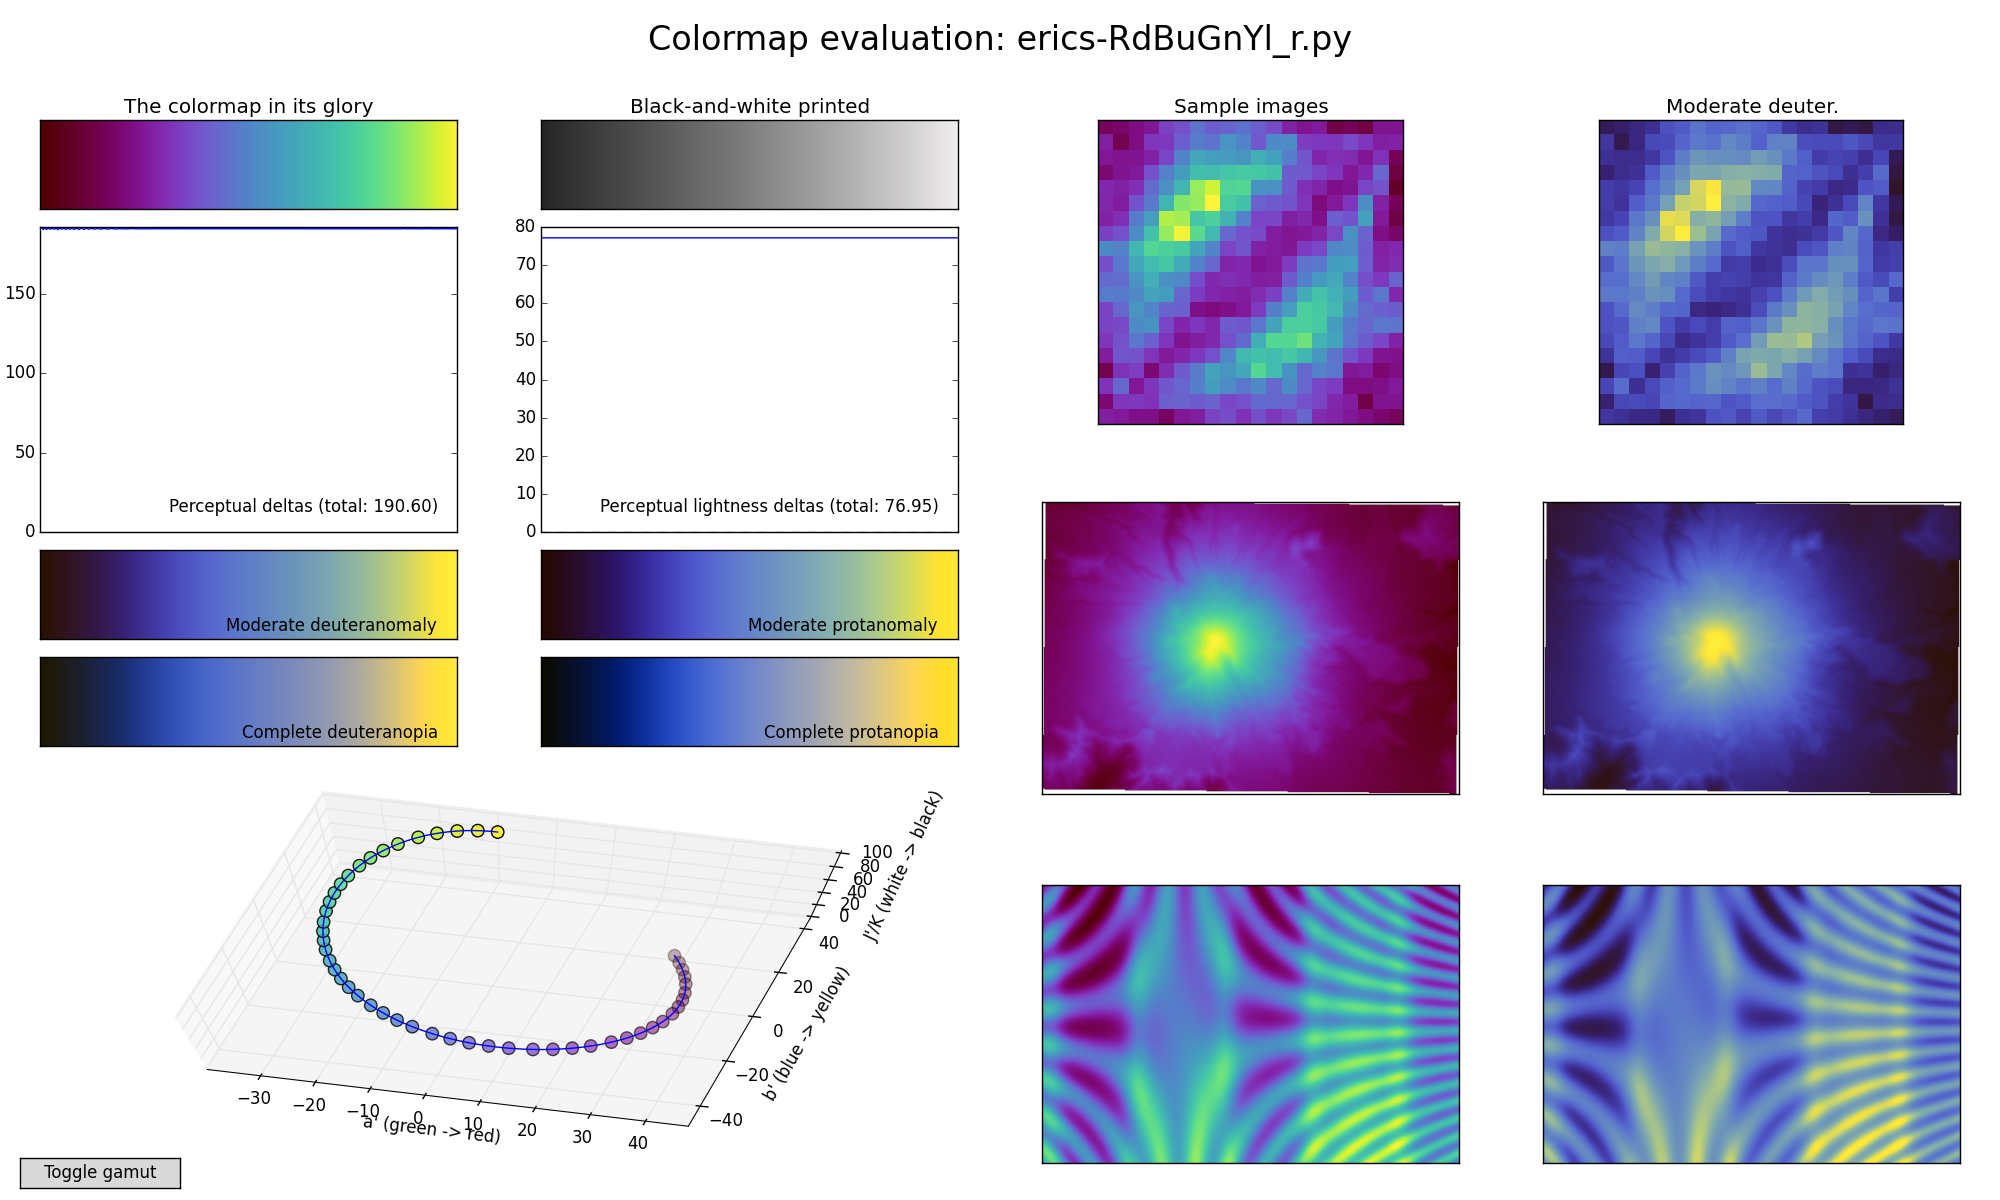
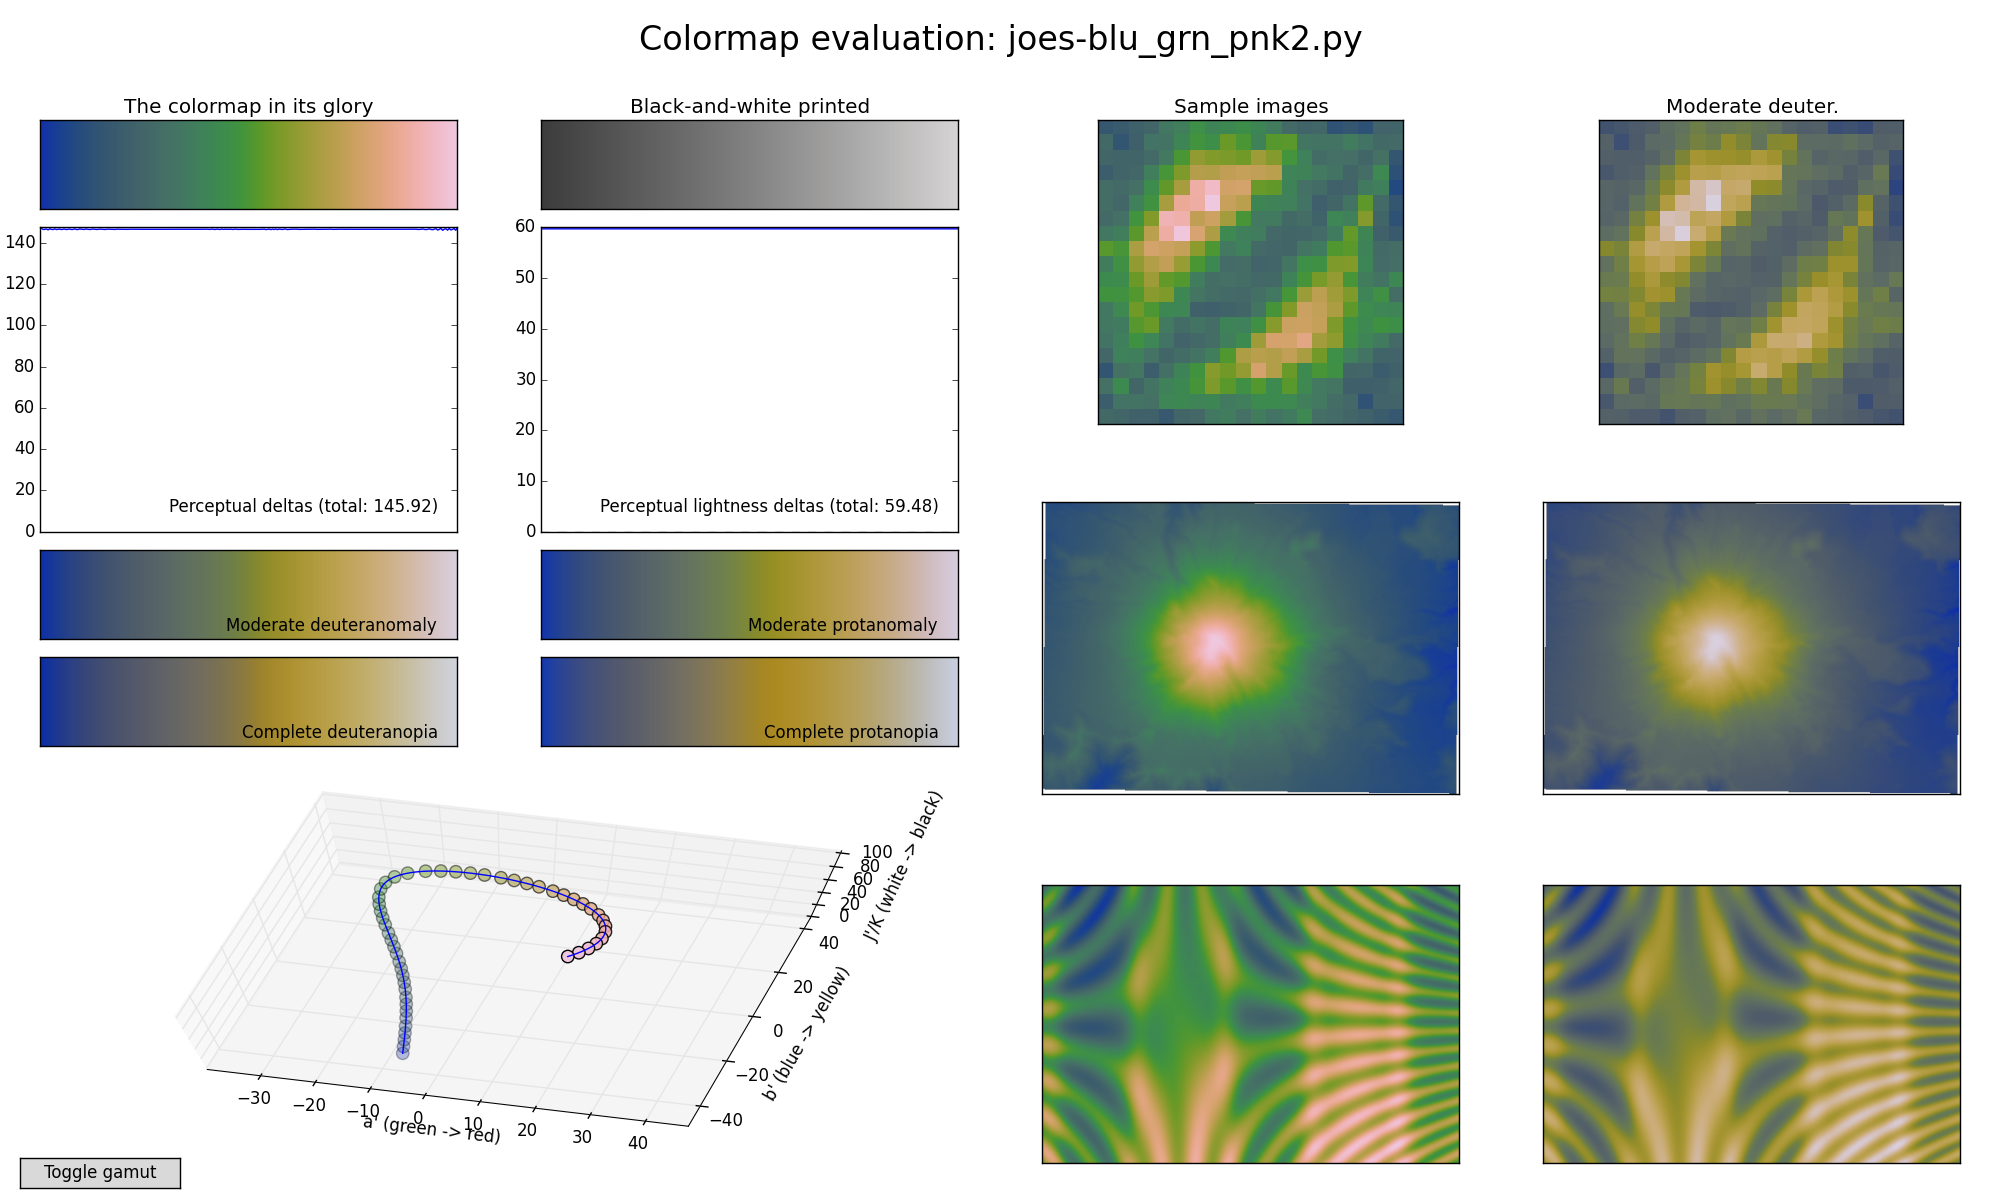
On Tue, Jun 16, 2015 at 7:14 PM, Nathaniel Smith <nj...@po...> wrote:
[...snip discussion of how option D was the favorite of 80% of people
in the survey...]
> So the next question is where we go from here. We need to pick a color
> for this bikeshed at some point. One theory is that the next step is
> to propose a bunch of variations on option D and have another round of
> voting etc. Another is that we should just call it a day and decide
> now :-).
>
> For reference, here's option D:
> https://bids.github.io/colormap/images/screenshots/option_d.png
>
> And here are the other greenish colormaps that have been mentioned:
> https://bids.github.io/colormap/images/screenshots/fake_parula.png
> https://bids.github.io/colormap/images/screenshots/erics-RdBuGnYl_r.png
> https://bids.github.io/colormap/images/screenshots/erics-RdBuGnYl_r_v2.png
> https://bids.github.io/colormap/images/screenshots/joes-blu_grn_pnk2.png
>
> My personal feeling is that all these alternatives are basically
> reasonable colormaps, but compared to option D I find them kinda ugly,
> and, more importantly, substantially worse for colorblind users, which
> IMO should outweigh a marginal/debateable improvement for the rest of
> us.
>
> So if it were up to me I'd be inclined to declare we've reached the
> point of diminishing returns and go with D, but I don't know how
> everyone else is feeling. Shall we just go for it?
So it's been 2 weeks with no real followup on this. I don't really
care where we end up (though I selfishly would somewhat prefer if
there is a decision before our SciPy talk next week, just so we can
tell people what it is :-)), but we need to resolve this somehow.
What's the plan?
Michael, Thomas, I see from the credits page that you're the Official
Lead Developers :-), so given the intrinsic bikeshedditude of this
topic I suspect it may come down to you taking a deep breath and
making a decision (or at least declaring some specific concrete
process for making the decision)?
-n
--
Nathaniel J. Smith -- http://vorpus.org
Hey all,
I just moved the stand alone cycler repo to be owned by the matplotlib org
in preparation for it (hopefully) be a required dep in the near future.
The plan is to get a v0.9 up on pypi ASAP and I will be pushing directly to
master for the time being. Once it is tagged and posted I would like to go
to the standard PR work flow.
The idea is to have a tagged version in the wild for people to play with
and then tag cycler v1.0 along with mpl v1.5.
Tom