-
-
Notifications
You must be signed in to change notification settings - Fork 8k
New "extend" keyword to colors.BoundaryNorm #5034
New issue
Have a question about this project? Sign up for a free GitHub account to open an issue and contact its maintainers and the community.
By clicking “Sign up for GitHub”, you agree to our terms of service and privacy statement. We’ll occasionally send you account related emails.
Already on GitHub? Sign in to your account
Conversation
How is this different that the over/under functionality we already have?
Do you mean Colormap.set_over() ? It is different in how BoundaryNorm() is choosing the colors within the levels' range. If you set_over(), the color of the last box before the extension will still be the last color of the colormap.
It is probable that I missed the way to do what I need without this PR, but I couldn't find any example in the gallery. @efiring seemed to agree on the rationale of this PR, but if proven useless I have no problem to close it (I just found it quite useful myself).
Sorry, left a comment without reading enough context 😞
The point of this is to reserve levels in the normalization to use as the over/under colors ? I see how to do this using existing tools and it is annoying.
How does this interact with the clip kwarg?
That's a good point: using clip=True and anything else than extend='neither' makes no sense, unless you want to clip the data and keep the normalized colors of the example 2 above, which is a very strange use case.
Currently something silently happens if you set extend and clip together, but it seems wrong. Should I force extend to "neither" if clip==True, or should I take care of the use-case above?
(I hope its clear enough, otherwise I can provide an example)
I am generally in favor of noisy exceptions (ex if extend is not 'neither', raise if clip is True).
Instead of calling this 'extend' in the normalization class, how about 'open_ends' or something like that? It seems what this is really specifying is if there should be an implicit +/- inf on the edges of the boundary list.
I agree with raising an exception.
The reason for calling it extend= is that it really merges the concepts of BoundaryNorm and Colorbar. If you recall the gallery example http://matplotlib.org/examples/api/colorbar_only.html (example 3), the keywords "boundaries" and "ticks" are actually redundant (because ColorbarBase knows about the norm properties).
Ideally, in my example above, the extend keyword in the call to ColorbarBase should be unnecessary. I think that it is possible to do this automatically but I didn't want to invest too much time in it without asking you first.
That is exactly why I don't want to call it extend. My knee-jerk reaction to reduce the coupling between the normalization classes and the colorbar base class.
I am in general very very wary of doing things automatically, but can be convinced otherwise.
:D
From my point-of-view (quite new to python after a long time with IDL), the example of http://matplotlib.org/examples/api/colorbar_only.html is horribly wordy. In fact, I assume that it was written in times before that the ColorbarBase base class was able to get all these infos from the normalization classes. It seems that the coupling you are complaining about already occurred ;).
For my own purposes I made a small library which adds this functionality and adds some higher level wrappers in order to prevent any mismatch between data, plot, and colorbar, which seems to be quite easy to occur with matplotlib.
But one argument in favour of decoupling however is that various functions seem to react differently to the norm class.
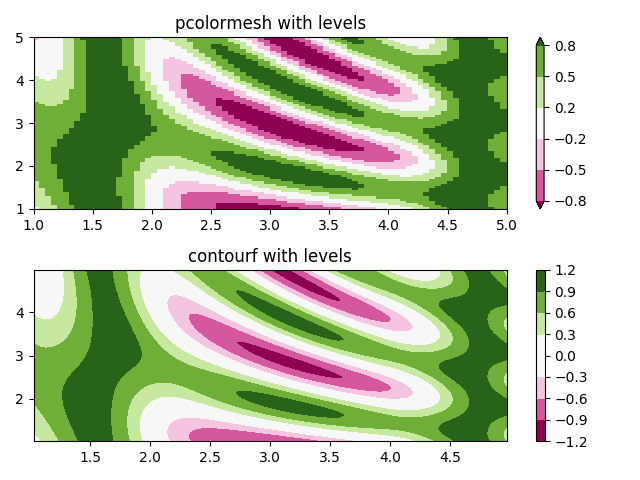
I'll misuse another example (http://matplotlib.org/examples/images_contours_and_fields/pcolormesh_levels.html). I just changed the levels in order to make use of extend='both':
import matplotlib.pyplot as plt
from matplotlib.colors import BoundaryNorm
import numpy as np
# Make the data
dx, dy = 0.05, 0.05
y, x = np.mgrid[slice(1, 5 + dy, dy),
 slice(1, 5 + dx, dx)]
z = np.sin(x) ** 10 + np.cos(10 + y * x) * np.cos(x)
z = z[:-1, :-1]
# Z roughly varies between -1 and +1
# my levels are chosen so that the color bar should be extended
levels = [-0.8, -0.5, -0.2, 0.2, 0.5, 0.8]
cmap = plt.get_cmap('PiYG')
norm = BoundaryNorm(levels, ncolors=cmap.N, extend='both')
# Plot 1
plt.subplot(2, 1, 1)
im = plt.pcolormesh(x, y, z, cmap=cmap, norm=norm)
plt.colorbar(extend='both')
plt.axis([x.min(), x.max(), y.min(), y.max()])
plt.title('pcolormesh with levels')
# Plot 2
plt.subplot(2, 1, 2)
plt.contourf(x[:-1, :-1] + dx / 2.,
 y[:-1, :-1] + dy / 2., z, levels=levels,
 cmap=cmap, extend='both')
plt.colorbar()
plt.title('contourf with levels')
plt.show()
The two plots are equivalent and correct but for contourf, the extend call occurs in contourf, while for pcolormesh it has to occur at the colorbar call.
If I make no call to extend at all but choose clip=True (previous):
norm = BoundaryNorm(levels, ncolors=cmap.N, clip=True)
# Plot 1
plt.subplot(2, 1, 1)
im = plt.pcolormesh(x, y, z, cmap=cmap, norm=norm)
plt.colorbar()
plt.axis([x.min(), x.max(), y.min(), y.max()])
plt.title('pcolormesh with levels')
# Plot 2
plt.subplot(2, 1, 2)
plt.contourf(x[:-1, :-1] + dx / 2.,
 y[:-1, :-1] + dy / 2., z, levels=levels,
 cmap=cmap)
plt.colorbar()
plt.title('contourf with levels')
It is amusing to see that contourf chooses different colors (somehow in accordance with my use-case for extend?) and marks out of bounds with a white color.
To conclude: I'd prefer to have more control of the Normalize class on the plotting functions because the two are inherently related, BUT I can understand that this is going to be a mess if we start to change things...
Sorry for my confusing post above. I'll get back to you tomorrow after thinking about all this a bit more ;-)
In your second example, pcolor is doing what I expect for clip=True . In the contourf case the white areas at the high/low ends I suspect are np.nan which is mapped to 'bad' which iirc maps to transparent. The color that contourf hands to the normalization class is the center of the bands, not the edges, hence why it picks the same colors for the valid data in both cases.
In this case where you are using boundary norms the tight coupling is natural, but say you want to use contourf with a non-linear color map, but with linear levels.
Yes sorry, the contourf example was OT because it has nothing to do with the normalization.
I see two solutions:
- If we call the keyword "extend", it has to be taken into account by all functions that take
norm=*as argument. Otherwise it is misleading, since all other properties (such as bounds, colors and clipping) are already derived from the normalization class as shown by the pcolormesh example above. I largely prefer this solution because it is consistent and less buggy. However, I have too little experience with mpl to estimate the amount of changes that it would represent. - We call it something else and leave it as is it now. It would remain a minimal change and would maybe require a new gallery example to illustrate its use.
What do you think?
I don't quite understand 1. In both cases the plotting function takes in some data, does some computation, and then gets a scalar out. This scaler is then passed to the norm to be re-scaled to [0, 1] (or [0, N]) and the rescaled value is then passed to cmap to be turned into an RGBA value. I don't think there is any case where the plotting functions are introspecting anything about norm. In the pcolormesh case each square is just going through that mapping process.
Yes, ok. I don't understant all the details of what is going under the hood when a call to pyplot.colorbar is made:
norm = BoundaryNorm(levels, ncolors=cmap.N, extend='both')
# Plot 1
plt.subplot(2, 1, 1)
im = plt.pcolormesh(x, y, z, cmap=cmap, norm=norm)
plt.colorbar()
plt.title('pcolormesh, forgot extend to colorbar')
# Plot 2
plt.subplot(2, 1, 2)
im = plt.pcolormesh(x, y, z, cmap=cmap, norm=norm)
plt.colorbar(extend='both')
plt.title('pcolormesh with levels')
So the plot is fine with my new implementation, so it's really just about the colorbar. I guess that since the colorbar knows the levels I've chosen, it must know about the normalize object I gave to pcolormesh.
You will have to ask @efiring about the colorbar code.
Ok, the change needed to make it do what I needed was minimal, but I have too little overview of the whole thing to judge if it's a good thing or not. If find it more consistent since no double call is needed, but I can understand that it is quite a specific requirement of mine.
By adding:
if hasattr(norm, 'extend') and norm.extend != 'neither':
 extend = norm.extend
in ColorbarBase's init I am forcing the keyword to what I want. If you agree on the "intrusion" I will add a few tests, if not we should decide on a name for the keyword.
My previous examples now look like this:
""" Illustrate the use of BoundaryNorm wht the "extend" keyword """
import matplotlib.pyplot as plt
import matplotlib as mpl
# Make a figure and axes with dimensions as desired.
fig, (ax1, ax2) = plt.subplots(2, 1, figsize=(6, 2))
# Set the colormap and bounds
bounds = [-1, 2, 5, 7, 12, 15]
cmap = mpl.cm.get_cmap('viridis')
# Default behavior
norm = mpl.colors.BoundaryNorm(bounds, cmap.N)
cb1 = mpl.colorbar.ColorbarBase(ax1, cmap=cmap, norm=norm, extend='both',
 orientation='horizontal')
cb1.set_label('Default BoundaryNorm ouput');
# New behavior
norm = mpl.colors.BoundaryNorm(bounds, cmap.N, extend='both')
cb2 = mpl.colorbar.ColorbarBase(ax2, cmap=cmap, norm=norm,
 orientation='horizontal')
cb2.set_label("With new extend='both' keyword");
plt.tight_layout()
plt.show()
import matplotlib.pyplot as plt
from matplotlib.colors import BoundaryNorm
import numpy as np
# Make the data
dx, dy = 0.05, 0.05
y, x = np.mgrid[slice(1, 5 + dy, dy),
 slice(1, 5 + dx, dx)]
z = np.sin(x) ** 10 + np.cos(10 + y * x) * np.cos(x)
z = z[:-1, :-1]
# Z roughly varies between -1 and +1
# my levels are chosen so that the color bar should be extended
levels = [-0.8, -0.5, -0.2, 0.2, 0.5, 0.8]
cmap = plt.get_cmap('PiYG')
norm = BoundaryNorm(levels, ncolors=cmap.N, extend='both')
# Plot 1
plt.subplot(2, 1, 1)
im = plt.pcolormesh(x, y, z, cmap=cmap, norm=norm)
plt.colorbar()
plt.title('setting extend=both is obsolete')
# Plot 2
plt.subplot(2, 1, 2)
im = plt.pcolormesh(x, y, z, cmap=cmap, norm=norm)
plt.colorbar(extend='neither')
plt.title('extend=neither however is ignored')
plt.tight_layout()
plt.show()
Sorry to have let this slide for so long; I will try to spend some time on it today. Something along these lines will be good, but I think there might be a better approach: a norm kwarg (or pair of kwargs) that changes the target range from 0-1 to some other range. I think this might handle the use case for this PR in a very general way (e.g., by setting the target range to [0.1, 0.9]), and as a bonus, handle some other use cases at the same time.
My drive-by comment on this is that there should be a way to do this without breaking any existing code. If the user says extend='neither' then they should get neither. I think this can be done by changing the default to None, if it is None then consult the norm then fall back to the current default. If the user passes in a non-None value, respect it.
What I'm suggesting does not inherently involve an "extend" kwarg, or any magic; it would be entirely explicit, and would have no effect on existing code. It would be independent of the "extend" kwargs in colorbar and contourf.
@efiring Any update on this?
I'll make a point of getting back to this and other color questions no later than this weekend. Thanks for the reminder.
Sorry I was not able to be more helpful on this one. Let me know if I can do anything.
As a side note, xray already implements the logic I'm asking for:
import xray
a = xray.DataArray([[1,2,3],[4,5,6]])
a.plot(levels=[2,3,4,5]);
Will produce (note the colorbar colors):
xray_logic
Maybe @shoyer can comment on this (no need to read all my lengthy examples, the original post will suffice).
This looks consistent with the way contourf works. I like it. @fmaussion, would you make the one change suggested by @tacaswell, please? If I understand correctly, the point is that if the call to colorbar includes an extend kwarg, then that should be respected, regardless of whether the norm also has an extend kwarg. It's only a subtle difference and small change from what you have.
shoyer
commented
Nov 9, 2015
Yes, I think I agree with this change. With xray, we did some work to make an external wrappers for pcolormesh, imshow and contourf that handles levels, extend and plot bounds that work identically for each plot type (although the underlying plot is produced differently). All this code exists in our plotting module and you're free to adapt anything you like, of course (we use an Apache license).
@efiring OK, I'll get back to this soon.
I've incorporated @tacaswell requirements and added an image test (see the image here)
The failing test seems unrelated to my changes: it concerns only one single test environment?
I'd like to update the examples for the documentation too but I will do this in a separate PR.
I restarted that test environment. Some of the tests can be a bit finicky on cloud environments.
There was a problem hiding this comment.
Choose a reason for hiding this comment
The reason will be displayed to describe this comment to others. Learn more.
Thanks so much for the persistence with this.
Some comments before I approve. I think this could really benefit from a "real" example rather than just plotting the colorbars. BoundaryNorm is covered in
https://matplotlib.org/users/colormapnorms.html#discrete-bounds if you want a ready-made example.
lib/matplotlib/colors.py
Outdated
There was a problem hiding this comment.
Choose a reason for hiding this comment
The reason will be displayed to describe this comment to others. Learn more.
This is confusing/vague. I think you mean: "Reserve the first (last) colors of the colormap for data values below (above) the first (last) boundary value."
lib/matplotlib/colors.py
Outdated
There was a problem hiding this comment.
Choose a reason for hiding this comment
The reason will be displayed to describe this comment to others. Learn more.
Does this work for small/large numbers? I'd think a safer number would be [2 * _b[0] - _b[1]] (i.e. b-db[0]). You know someone will put in boundaries=[1e50, 2e50, ...] at some point. Though maybe this works anyways in that case?
lib/matplotlib/colors.py
Outdated
There was a problem hiding this comment.
Choose a reason for hiding this comment
The reason will be displayed to describe this comment to others. Learn more.
Could get rid of one if statement with:
if extend in ['min', 'both']:
 _b = [_b[0] - 1] + _b
if extend in ['max', 'both']:
 _b = _b + [_b[-1] + 1]
There was a problem hiding this comment.
Choose a reason for hiding this comment
The reason will be displayed to describe this comment to others. Learn more.
OK, I'll grump about this example. Can we make it a real plot instead of a floating colorbar? The use case is opaque without some (fake) data to clarify it.
@fmaussion, I have a proposed simplification of the calculation. May I push to your repo? If so, I think there is something you need to click to add me as a collaborator.
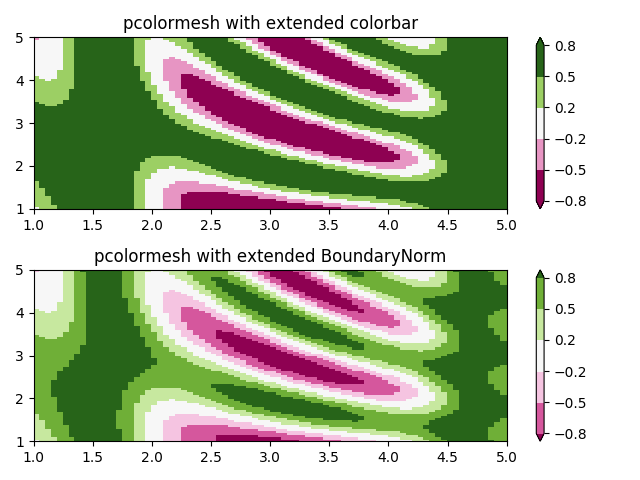
@efiring @jklymak I updated the PR with the following example which motivated this PR:
import matplotlib.pyplot as plt
from matplotlib.colors import BoundaryNorm
import numpy as np
# Make the data
dx, dy = 0.05, 0.05
y, x = np.mgrid[slice(1, 5 + dy, dy),
 slice(1, 5 + dx, dx)]
z = np.sin(x) ** 10 + np.cos(10 + y * x) * np.cos(x)
z = z[:-1, :-1]
# Z roughly varies between -1 and +1
# my levels are chosen so that the color bar should be extended
levels = [-0.8, -0.5, -0.2, 0.2, 0.5, 0.8]
cmap = plt.get_cmap('PiYG')
# Before this change
plt.subplot(2, 1, 1)
norm = BoundaryNorm(levels, ncolors=cmap.N)
im = plt.pcolormesh(x, y, z, cmap=cmap, norm=norm)
plt.colorbar(extend='both')
plt.axis([x.min(), x.max(), y.min(), y.max()])
plt.title('pcolormesh with extended colorbar')
# With the new keyword
norm = BoundaryNorm(levels, ncolors=cmap.N, extend='both')
plt.subplot(2, 1, 2)
im = plt.pcolormesh(x, y, z, cmap=cmap, norm=norm)
plt.colorbar() # note that the colorbar is updated accordingly
plt.axis([x.min(), x.max(), y.min(), y.max()])
plt.title('pcolormesh with extended BoundaryNorm')
plt.show()
I've also authorized edits from maintainers. Please feel free to make any change.
Dear all, I am away from my laptop for the next three weeks - feel free to edit / merge as you wish.
There was a problem hiding this comment.
Choose a reason for hiding this comment
The reason will be displayed to describe this comment to others. Learn more.
This example is pretty long for a rarely used kwarg - suggest just linking the real example...
There was a problem hiding this comment.
Choose a reason for hiding this comment
The reason will be displayed to describe this comment to others. Learn more.
Oh hmmm, there is no example. Suggest this gets put in the appropriate section of examples/
There was a problem hiding this comment.
Choose a reason for hiding this comment
The reason will be displayed to describe this comment to others. Learn more.
This example is pretty long for a rarely used kwarg
I still wonder how people are doing that without this kwarg, but well. ;-)
Suggest this gets put in the appropriate section of examples/
will do
While trying to add the concept to this example, I noticed that the coupling between norm and colorbar in the case of contourf does not work as expected :'-( :
import matplotlib
import matplotlib.pyplot as plt
from matplotlib.colors import BoundaryNorm
from matplotlib.ticker import MaxNLocator
import numpy as np
# make these smaller to increase the resolution
dx, dy = 0.05, 0.05
# generate 2 2d grids for the x & y bounds
y, x = np.mgrid[slice(1, 5 + dy, dy),
 slice(1, 5 + dx, dx)]
z = np.sin(x)**10 + np.cos(10 + y*x) * np.cos(x)
# x and y are bounds, so z should be the value *inside* those bounds.
# Therefore, remove the last value from the z array.
z = z[:-1, :-1]
# Z roughly varies between -1 and +1
# my levels are chosen so that the color bar should be extended
levels = [-0.8, -0.5, -0.2, 0.2, 0.5, 0.8]
# pick the desired colormap, sensible levels, and define a normalization
# instance which takes data values and translates those into levels.
cmap = plt.get_cmap('PiYG')
norm = BoundaryNorm(levels, ncolors=cmap.N, extend='both')
fig, (ax0, ax1) = plt.subplots(nrows=2)
im = ax0.pcolormesh(x, y, z, cmap=cmap, norm=norm)
fig.colorbar(im, ax=ax0)
ax0.set_title('pcolormesh with levels')
# contours are *point* based plots, so convert our bound into point
# centers
cf = ax1.contourf(x[:-1, :-1] + dx/2.,
 y[:-1, :-1] + dy/2., z,
 cmap=cmap, norm=norm)
fig.colorbar(cf, ax=ax1)
ax1.set_title('contourf with levels')
# adjust spacing between subplots so `ax1` title and `ax0` tick labels
# don't overlap
fig.tight_layout()
plt.show()
Why is that so? Why should the signature of contourf and pcolormesh be different?
Using BoundaryNorm with contourf makes no sense at all. Maybe it should trigger a warning. I suppose the alternative you are expecting is that contourf, when given a BoundaryNorm, would take its levels from that. This seems to me like needless complexity, though.
Contourf is fundamentally based on discrete levels; pcolormesh starts out with the opposite point of view, that it is representing a continuum. BoundaryNorm provides a discretization mechanism for pcolormesh, but the discretization is built in to contourf.
Thanks for the quick reply. I will write a new dedicated example then
@jklymak and @fmaussion As far as you can see, is anything needed beyond a rebase? Are there outstanding questions still to be resolved? It would be nice to get this finished and merged ASAP so it doesn't sit around for a few more years.
Away from a real computer for a few days so don’t wait for me!
@fmaussion I would like to get this merged. Are you available to resolve the conflict and address anything else that is pending?
The present conflict is that this PR is deleting tutorials/colors/colorbar_only.py. We definitely don't want to do that.
Apart from that, what's missing is the entry in "examples" or "tutorials" illustrating the new feature here.
@fmaussion This looks to be done, but needs a rebase and the colorbar_only tutorial re-instated! Did you want to tackle it, or should one of the devs?
It also looks like the example from api_changes needs to be moved to the reinstated colorbar_only.py tutorial (or somewhere).
This is a follow-up to #4850
Rationale: when using BoundaryNorm with a continuous colormap, you would want the colors of the extensions to be distinct from the colors of the nearest box (see example below).
Compatibility: there is no backward compatibility issue since the default behavior is unchanged
Limitations of the current implementation: it adds a bit of an overhead of code (not too much but still). An alternative implementation would be to make a new class, e.g. ExtendedBoundaryNorm in order to take over this functionality. Another issue is that it adds a behavior to one of the implementations of the Norm interface but not to the others. I am not sure which of the other classes might benefit from such a keyword.
Example
figure_1