Use Emacs Org-mode to graph your sleeping pattern.
This software is alpha-quality! The script was written to produce nice graphs for my own org file and it will give garbage if you feed it less than a few years of data.
The reason for raster images (instead of SVGs) is that it is hard to render thousands of lines and not have them rendered in a smudgy way. Raster images on 100% zoom always look perfect, anything else will typically look bad.
The script does pixel-banging, which is arguably easier than trying to force matplotlib or gnuplot to render 1-pixel lines. In fact, there were matplotlib and gnuplot versions of orgsleep, but they were only adequate before I surpassed a 2-year milestone. I'm still looking for a better solution, please let me know if there's something.
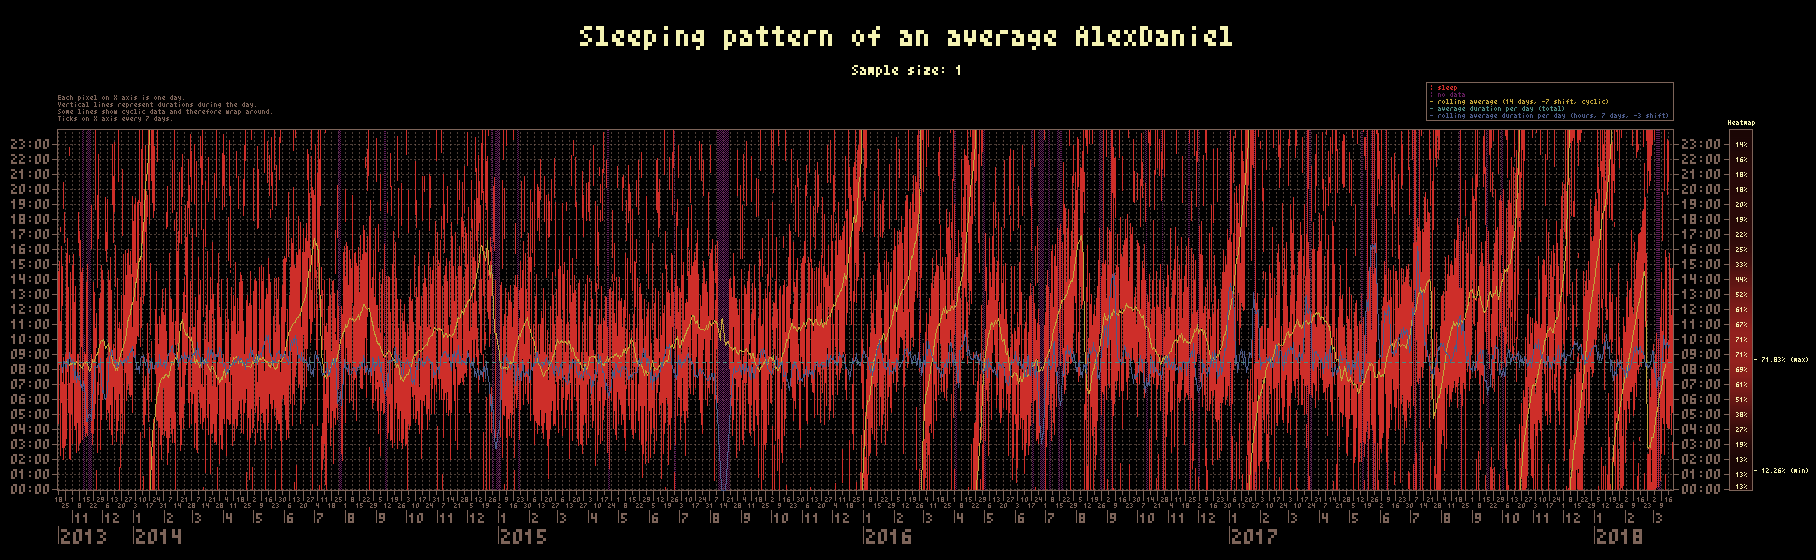
This command was used to generate the example:
bin/orgsleep '--title=Sleeping pattern of an average AlexDaniel' \
 '--subtitle=Sample size: 1' \
 '--out=examples/graph.png' \
 examples/sleep.org
Use your own org file to plot your data.
You must have Image::Magick Perl5 module installed. On Debian-based systems use:
sudo apt install libimage-magick-perl