I have a Pandas DataFrame that looks like this:
SIF_743,latitude,longitude
0.7626782059669495,-85.90831756591797,22.40107536315918
0.3139636516571045,-85.9532470703125,22.630943298339844
0.17063966393470764,-86.00765228271484,21.14249610900879
0.3484233617782593,-85.9980697631836,22.866853713989258
0.20155811309814453,-86.05291748046875,21.364904403686523
-0.17634174227714539,-86.10398864746094,19.85099220275879
-0.3291313946247101,-86.15137481689453,18.326879501342773
0.10919605940580368,-86.04275512695312,23.10919952392578
0.3178038001060486,-86.09805297851562,21.59358787536621
Is it possible to convert the data where "latitude" and "longitude" will represent a pixel and the "SIF_743" value will represent the DN value of that pixel with EPSG:4326 CRS?
3 Answers 3
Here is a possible solution:
import numpy as np
import pandas as pd
import geopandas as gpd
from geocube.api.core import make_geocube
A = np.array([
[0.7626782059669495,-85.90831756591797,22.40107536315918],
[0.3139636516571045,-85.9532470703125,22.630943298339844],
[0.17063966393470764,-86.00765228271484,21.14249610900879],
[0.3484233617782593,-85.9980697631836,22.866853713989258],
[0.20155811309814453,-86.05291748046875,21.364904403686523],
[-0.17634174227714539,-86.10398864746094,19.85099220275879],
[-0.3291313946247101,-86.15137481689453,18.326879501342773],
[0.10919605940580368,-86.04275512695312,23.10919952392578],
[0.3178038001060486,-86.09805297851562,21.59358787536621]
])
xmin = np.min(A[:,2])
xmax = np.max(A[:,2])
ymin = np.min(A[:,1])
ymax = np.max(A[:,1])
deltax = (xmax - xmin)/10
deltay = (ymax - ymin)/10
res = min([deltay, deltay])
df = pd.DataFrame(A)
df.columns = ['SIF_743','latitude','longitude',]
gdf = gpd.GeoDataFrame(
df,
geometry=gpd.points_from_xy(df.longitude, df.latitude)
)
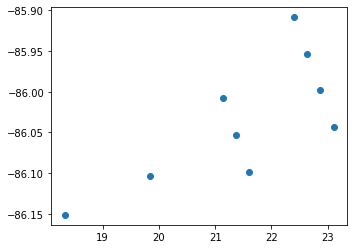
gdf.plot() # first image hereunder
geotif_file = "/tmp/raster.tif"
out_grd = make_geocube(
vector_data=gdf,
measurements=["SIF_743"],
resolution=(-res, res)
)
out_grd["SIF_743"].rio.to_raster(geotif_file)
Your data doesn't seem to be regular so it will not be straightforward to build an image out of this, unless you do some interpolation:
You will end up with this raster close to the south pole:
Documentation is here: https://corteva.github.io/geocube/html/geocube.html
A great tool for this is geocube. It will rasterize each of the columns in your geopackage (or a subset if you specify it).
Some examples of usage are listed here
To convert your csv file to geopandas: https://github.com/geopandas/geopandas/issues/2221
It can be as simple to use as:
import geopandas
from geocube.api.core import make_geocube
gdf = geopandas.read_file(
 "test_shp.csv",
 driver="CSV",
 x_possible_names="x,lon,longitude",
 y_possible_names="y,lat,latitude"
)
out_grid = make_geocube(
 vector_data=gdf,
 measurements=["SIF_743"],
 resolution=(-0.0001, 0.0001),
)
out_grid["SIF_743"].rio.to_raster("my_rasterized_column.tif")
You could convert the dataframe to geodataframe with geopandas and export it to vector format supported by OGR and then use gdal_rasterize.
Explore related questions
See similar questions with these tags.