I want to add to my vector file layers with some points to show animals occurrences in Germany for different years.
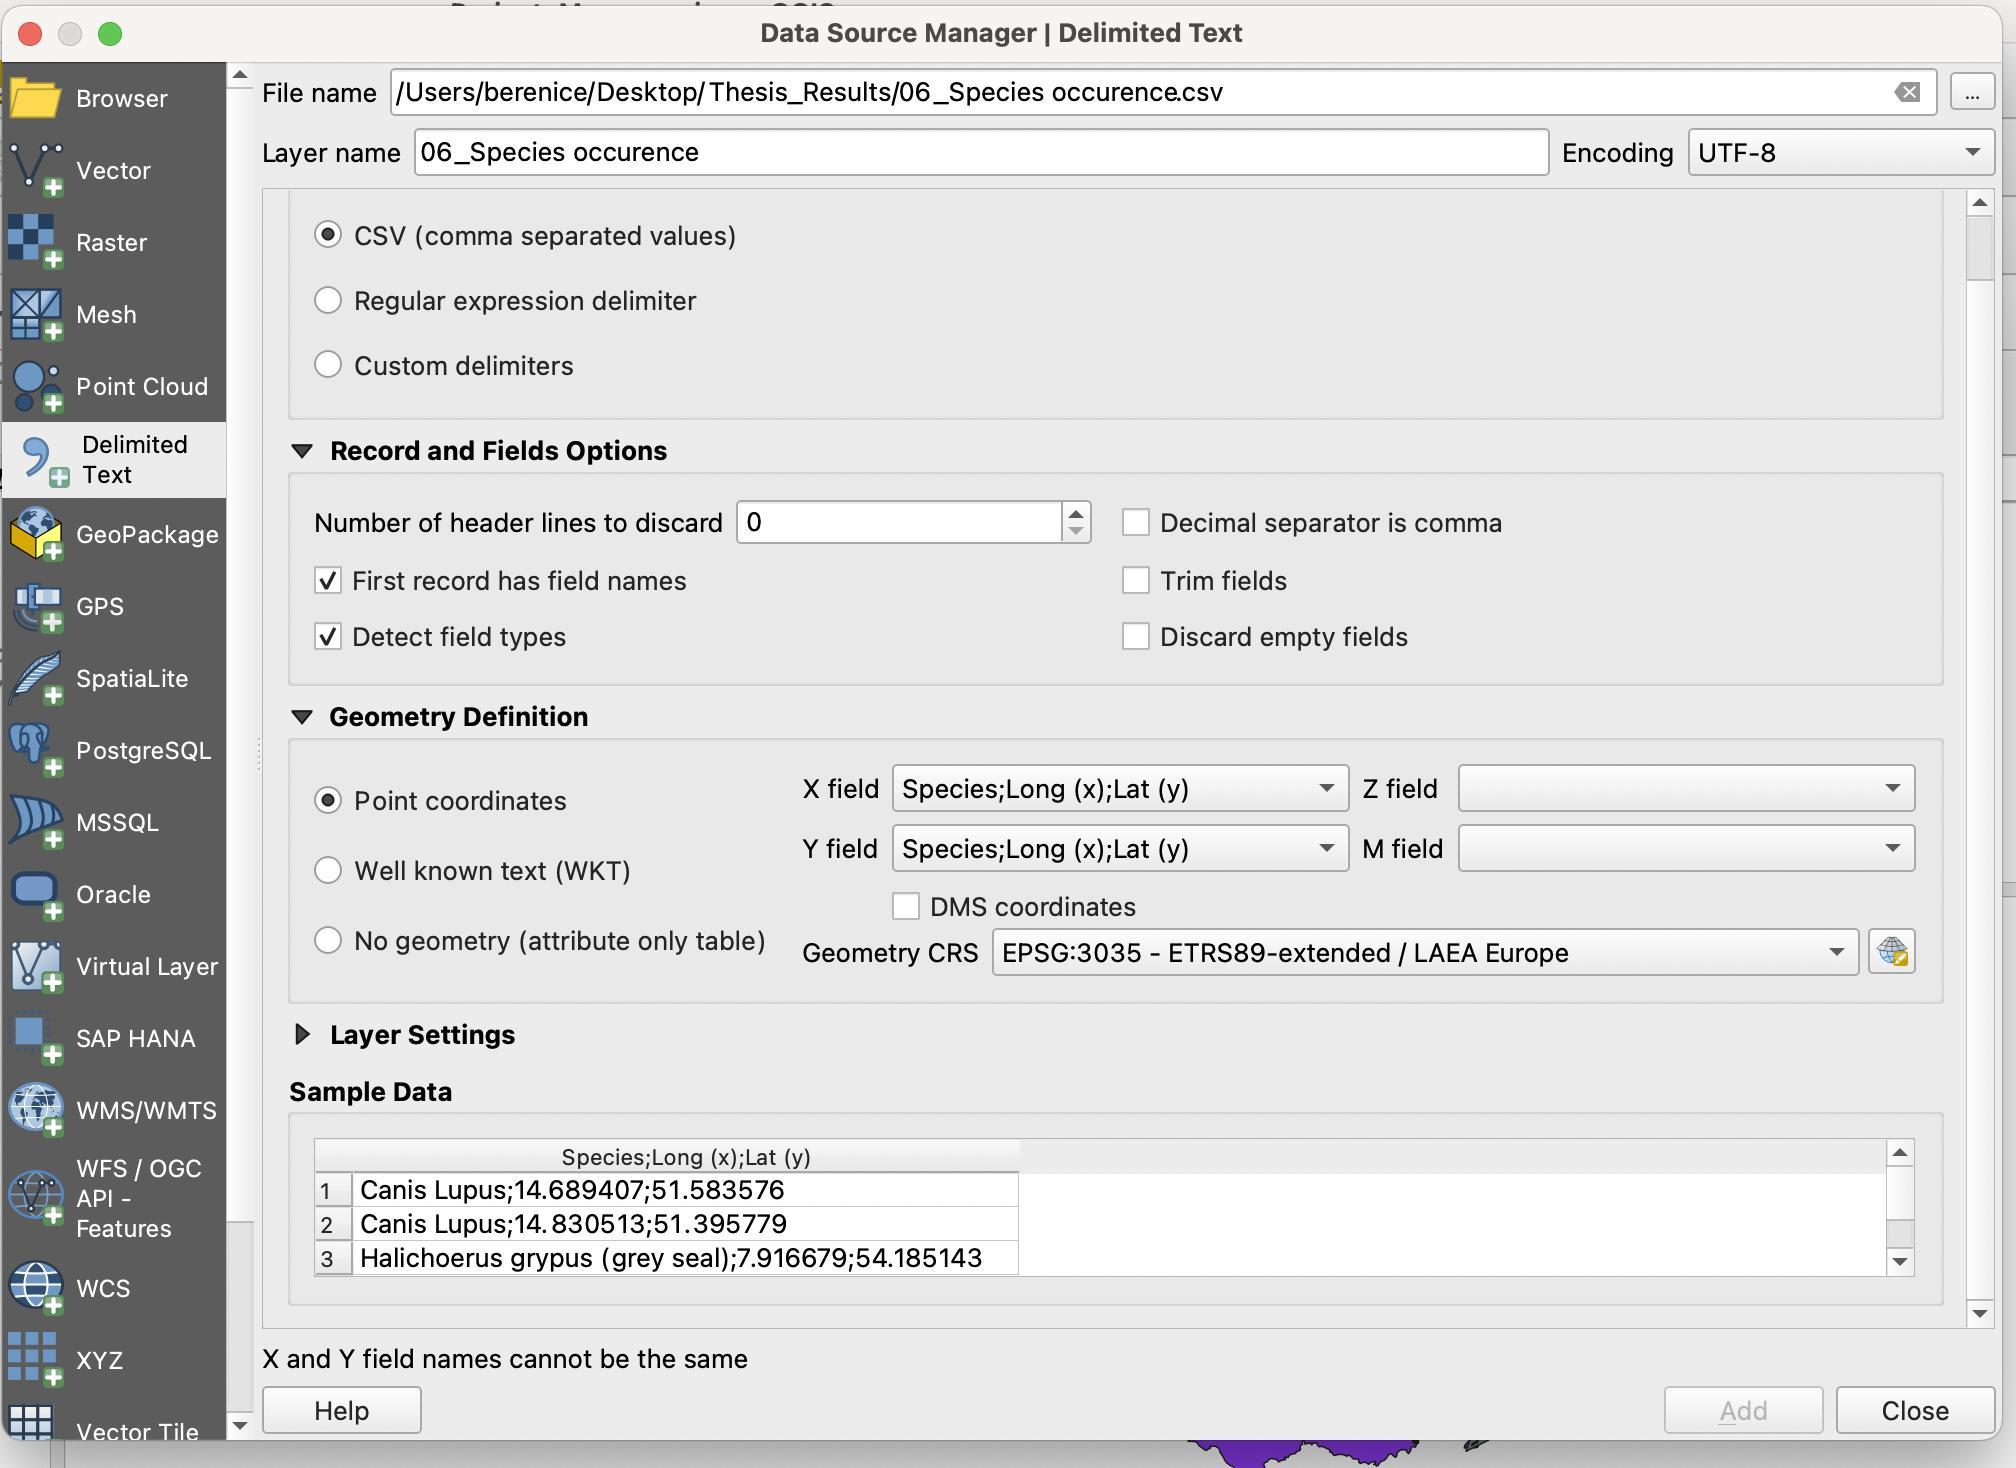
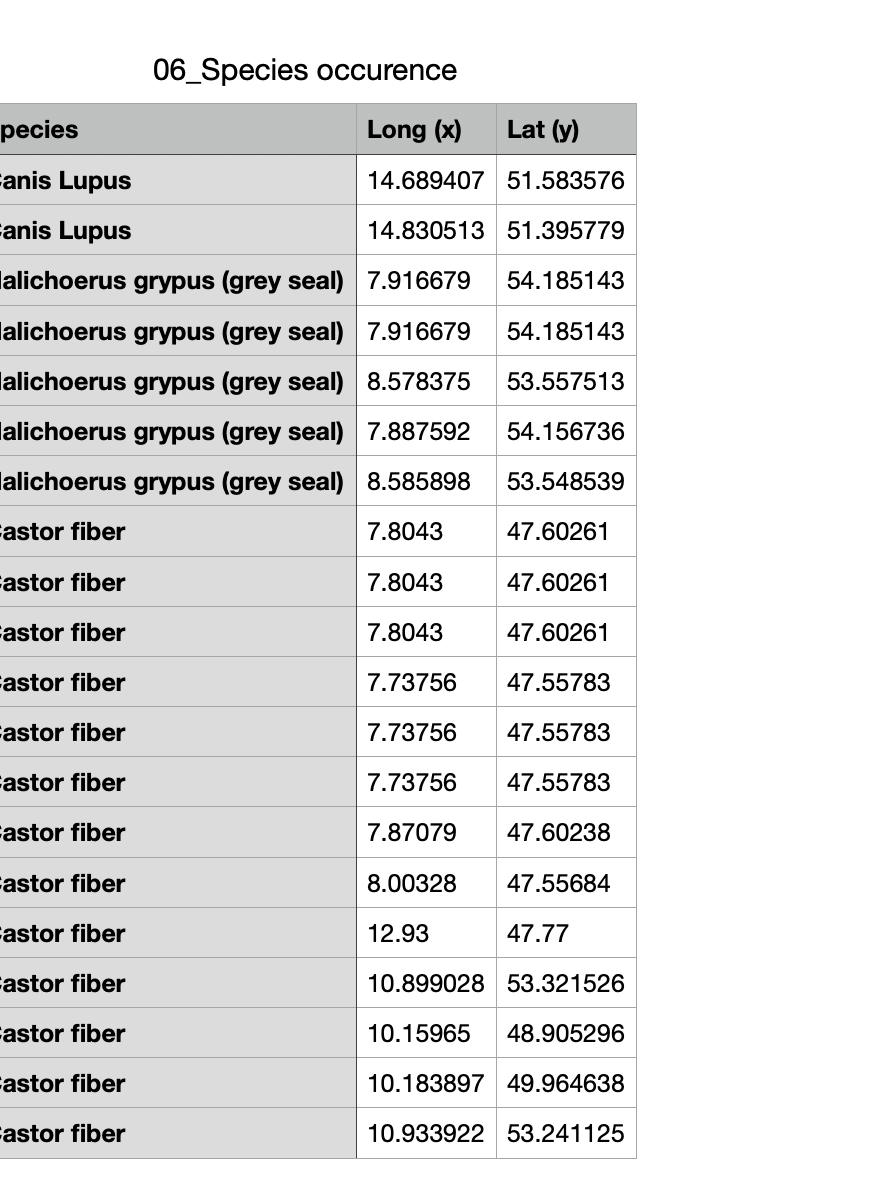
I have all the coordinates in a CSV file (see image attached) but when I want to charge it on QGIS (add layer "Data source manager/delimiter text") I actually can't.
-
11change it to custom delimiter and set it to ";" right now it tries to create breaks between columns with a "," which results in a single column with the name "Species;Long (x); Lat (y)".Vincé– Vincé2022年03月04日 15:23:23 +00:00Commented Mar 4, 2022 at 15:23
-
From your image, it seems QGIS fails to differenciate the fields (see "Y field" and "Y field"). Try telling it your separator is semi-colons and not commas. On another note, I am not 100% your field names can inclue spaces and brackets. I would avoid them.ChloeG– ChloeG2022年03月04日 15:24:19 +00:00Commented Mar 4, 2022 at 15:24
-
5The coordinates of EPSG:3035 are not decimal degrees but meters (northing/easting). If your coordinates are decimal degrees, then the CRS is not EPSG:3035nmtoken– nmtoken2022年03月04日 15:52:31 +00:00Commented Mar 4, 2022 at 15:52
-
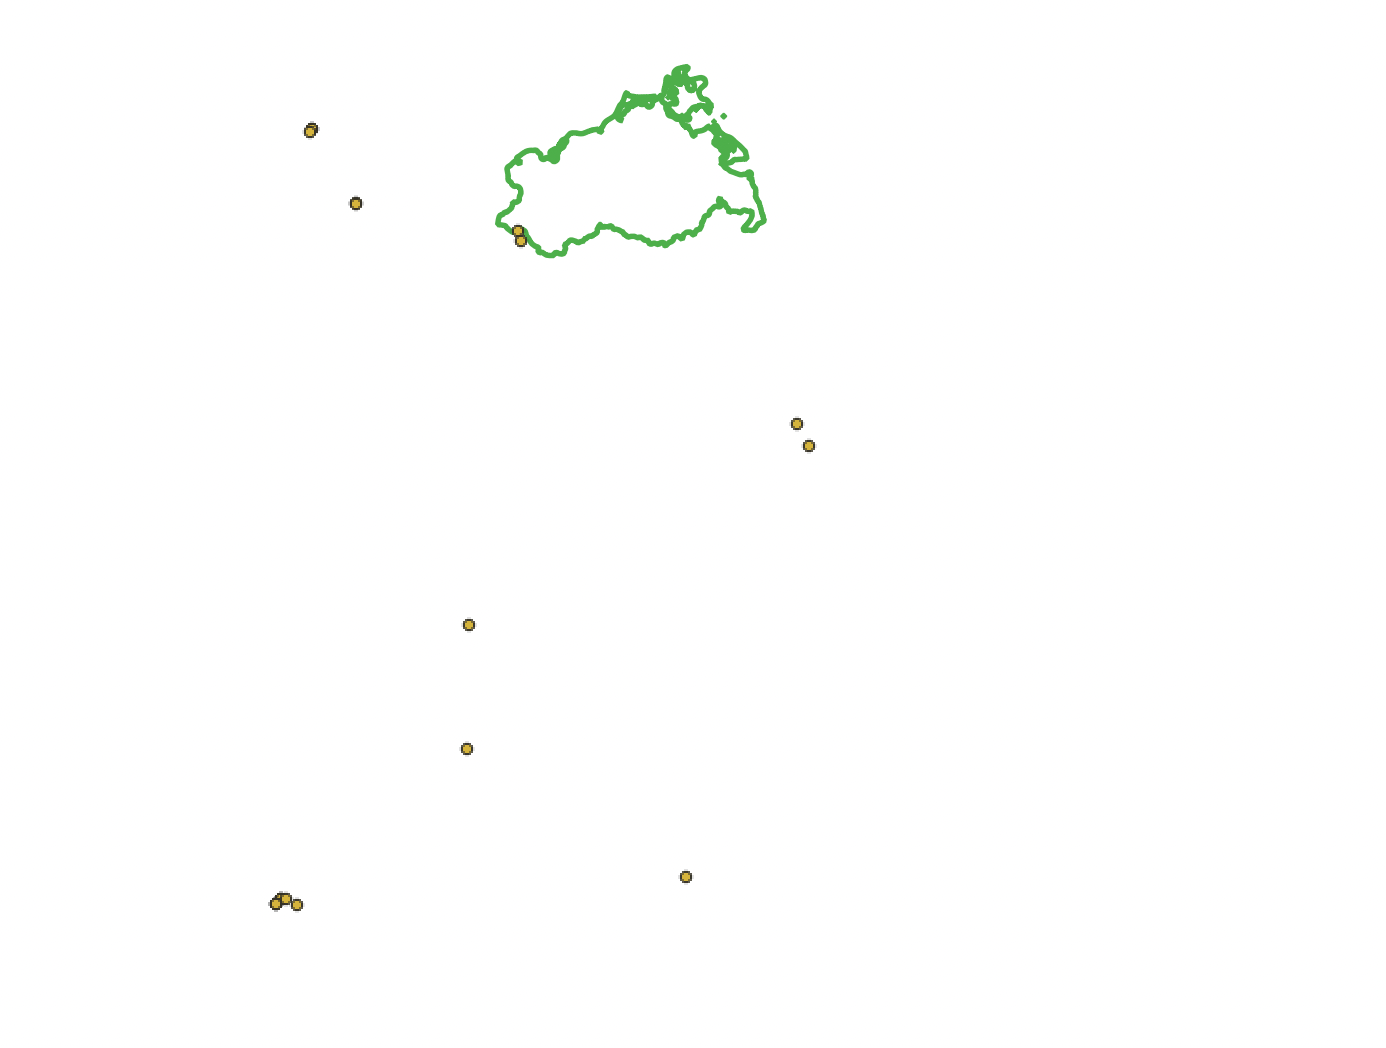
Thank you to all of you, I could charge my layer, however, my points do not appear on top of my already existing layers... (i.e. I want to see my species occurrences on the area I am looking at which is projected with CSR 30:35), do you know why? I added a screen capture for more detailsRobagb– Robagb2022年03月07日 08:59:24 +00:00Commented Mar 7, 2022 at 8:59
-
1As mentioned by @nmtoken your coordinates are expressed in decimal degrees. If I project your points using WGS 84 (EPSG: 4326), they are in Germany. Wolves in the East, seals on the coast or in the sea. You can later reproject your points to the desired CRS.ChloeG– ChloeG2022年03月07日 10:29:54 +00:00Commented Mar 7, 2022 at 10:29
2 Answers 2
I copied the first 7 points from your table in an Excel file. The first thing I did was setting the fields as numeric with 8 decimals (this avoids issues in ArcGIS, but I don't know if it is necessary in QGIS). I saved this file as a CSV:
Species;X;Y
Canis Lupus;14.68940700;51.39577900
Canis Lupus;14.83051300;51.39577900
Grey seal;7.91667900;54.18514300
Grey seal;7.91667900;54.18514300
Grey seal;8.57837500;53.55751300
Grey seal;7.88759200;54.15673600
Grey seal;8.58589800;53.54853900
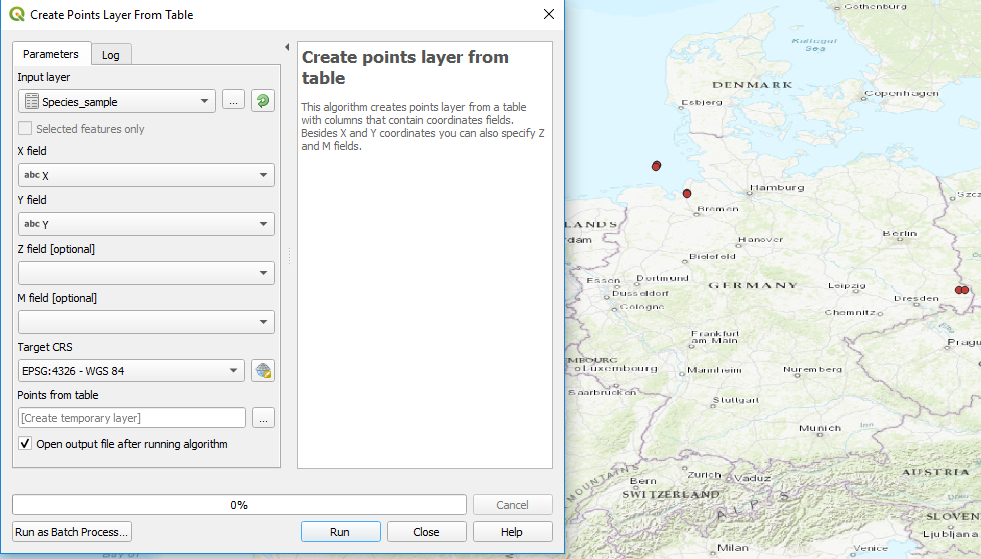
Then I used the "Create points layer from table" tool from QGIS. As your coordinate values seemed to be in decimal degrees, I used the default WGS 84 (EPSG: 2436): Screen capture of the tool settings and result
To reproject your data in the desired CRS, you can follow this tutorial.
I started by charging my csv file to add delimited text layer, I made sure to set it to ";" and I used the CRS WGS 84 (EPSG:4326) despite the fact than my project is in 3035.... I can see my points on the map :)
-
1If you want to understand more about why your data can be visualised despite the CRS being different to the project, you can read here about "on-the-fly" transformation.Matt– Matt2022年03月08日 10:13:21 +00:00Commented Mar 8, 2022 at 10:13
-
1