In QGIS 3.16 I've inherited a sloppy dataset of regional roads.
My problem is this:
Roads have been drawn over for updates and not deleted, leaving behind hundreds to thousands of overlapping segments representing the same street, but with slightly differing vertices.
I'd love to find a tool or write a python code that can iterate through each overlapping segment and combine nodes, keeping the total length of the two and averaging the displacement in between. Because of the number of these instances, manual editing is out of the question.
I have tried:
- Snap Nodes in QGIS - no apparent change
- Merge Linestrings in QGIS (summary = mean) - no apparent change
I don't think tools such as union, dissolve, merge, etc. will work for incongruous lines.
I've been trying to find a Python package with a function that might help, but am having trouble with the language needed to search for my needs. Most results are for lines that are displaced but otherwise identical.
-
If you change the geomtry of the line, the lenght will change automatically. An idea would be buffering both lines, dissolve the buffer and get the central axis from the buffer, see: gis.stackexchange.com/questions/319412/…Babel– Babel2021年08月27日 21:47:55 +00:00Commented Aug 27, 2021 at 21:47
2 Answers 2
Solution described for QGIS, should work the same way with other software packages:
Extract the vertices from line1.
For each vertex, find the closest point on line 2 and connect it with a line. Get the centroid of that line. To do so, use Geometry by expression, the vertices layer as input and output geometry type set to point. See below for the expression to use.
Connect these points using Points to path to create the new, average line.
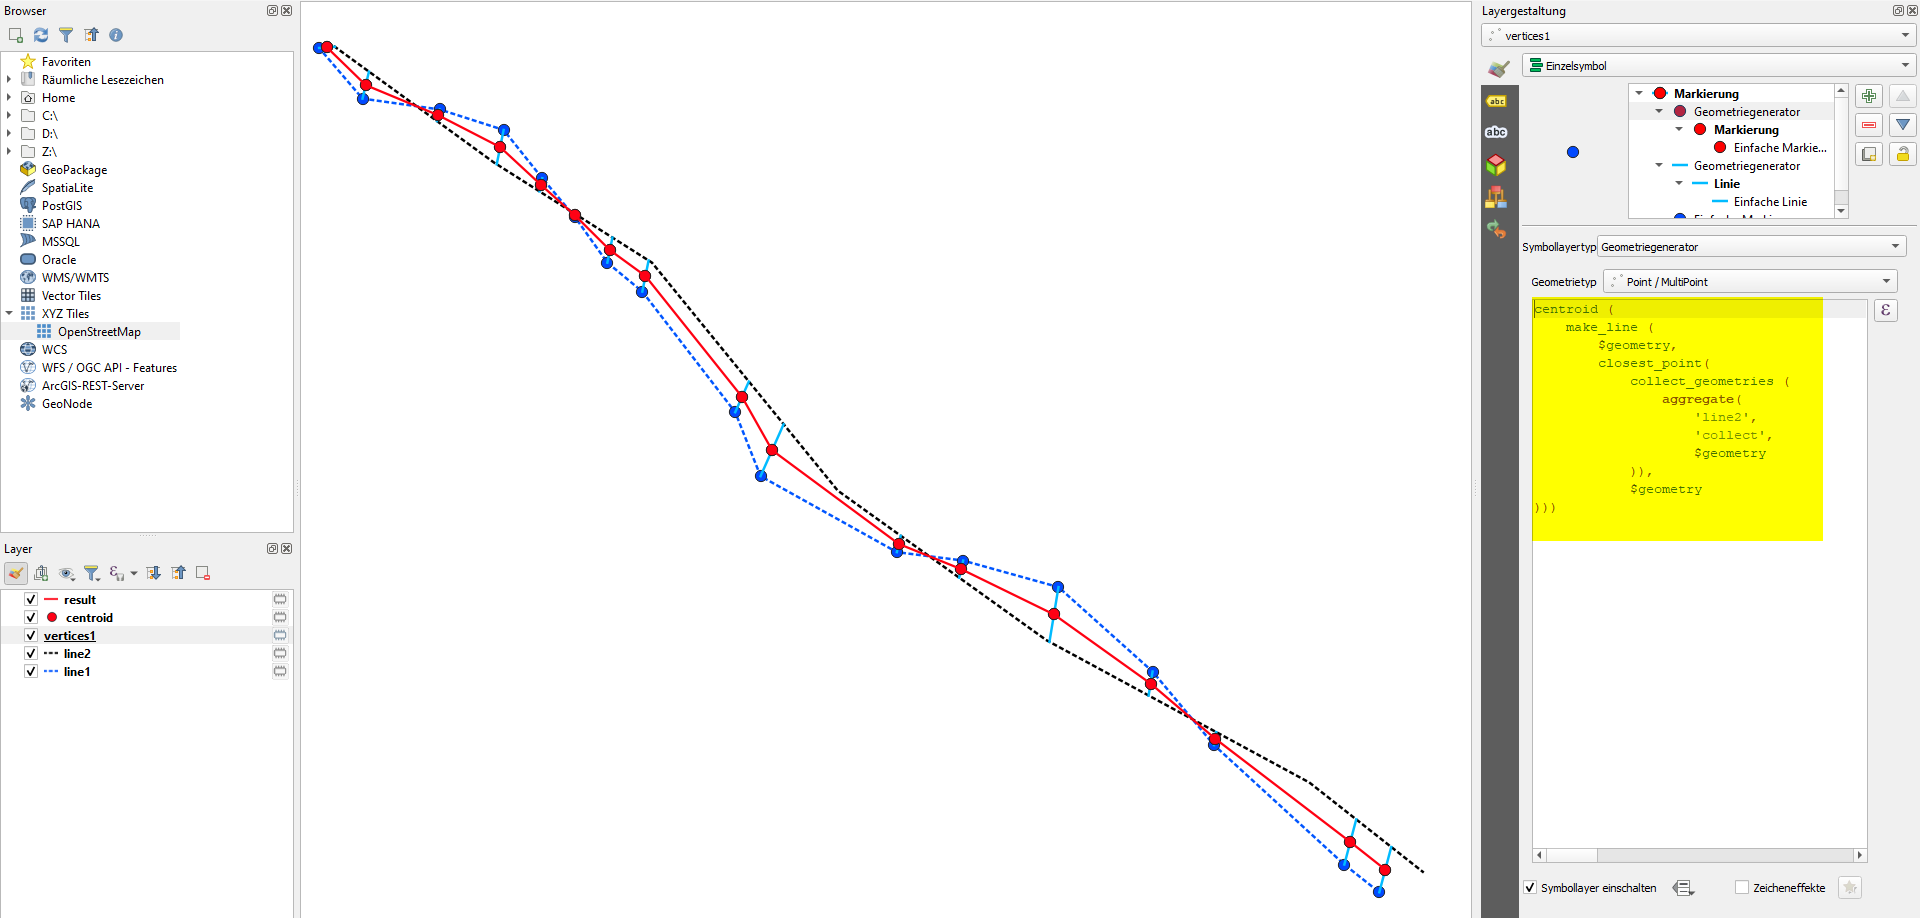
Expression to use for step 2 with Geometry by expression:
centroid (
 make_line (
 $geometry,
 closest_point(
 collect_geometries (
 aggregate(
 'line2',
 'collect',
 $geometry
 )),
 $geometry
)))
Screenshot: black and blue dotted = initial lines. Red solid line = resulting line. Blue dots: vertices of line1, light blue: line to the nearest point on line2; red dots: centroid of this line and verties of the red, resulting line:
-
I got only red dots without any line? Point to path, make the exact the same line like line1Frodo– Frodo2021年10月28日 05:46:24 +00:00Commented Oct 28, 2021 at 5:46
-
Can you share your data or a screenshot? Otherwise its difficult to helpBabel– Babel2021年10月28日 05:51:59 +00:00Commented Oct 28, 2021 at 5:51
-
-
You posted an answer with a screenshot. Please be aware that you should not do that, but rather post a new question (you can link to this one here). Your problem: you must create the red points with Geometry by expression (step 2, the expression) and then connect these points with points to path: you probably used the
Verticeslayer as input for point to path.Babel– Babel2021年10月28日 20:30:44 +00:00Commented Oct 28, 2021 at 20:30 -
Ok, how can I upload screenshot to comment message? I cant se any of point layer to convert point to line. Your answer is very imprecise. On right side You have 3 generated simbol, point, line pointFrodo– Frodo2021年10月29日 05:16:19 +00:00Commented Oct 29, 2021 at 5:16
Step by step: enter image description here
There is only one problem, the interpolation is not very precise? enter image description here
Explore related questions
See similar questions with these tags.