I have a source raster data set (tif file) and a number of polygon features. For each one of those polygons I need to:
a) 'clip' the raster.
b) change values of those clipped raster cells (with the average value).
c) write new values back to the source raster.
I've managed to do a and b, which means I now have a numpy.ndarray variable where all cells have been populated with the average value. How can I write this back to the source raster?
I believe I'd be able to write a script which could do such a thing. I have arrays dimensions (width and height) and top left cell's position, so I guess it'd just be a matter of operating with these arrays. However, I was wondering whether there's any existing function that does that already.
My code:
import os, sys, datetime, time
import geopandas as gpd
import gdal
import rasterio
from rasterio.mask import mask
from fiona.crs import from_epsg
import numpy as np
import pycrs
alr_path = Path to tif file
gdb_vml_polygs = Path to file gdb
fc_Building_footprints = r'Buildings_Footprints'
alr = rasterio.open(alr_path)
vml_polygs = gpd.read_file(gdb_vml_polygs, driver='FileGDB', layer=fc_Building_footprints)
for index, row in vml_polygs.iterrows():
 #row[3] contains the geometry
 window, out_transform = mask(alr, row[3], all_touched=True, crop=True)
 if np.all([window < 0]):
 avg = -1
 else:
 avg = window[window != -1].mean().item()
 window_avg = (np.where(window!=-1, int(round(avg,0)), window))
In the script window_avg is a numpy array containing the new values. How can I write these values back into the source raster?
3 Answers 3
I would recommend using rioxarray.
import numpy
import rioxarray
from shapely.geometry import mapping
xds = rioxarray.open_rasterio("NI_RIVER_ALR_1000.tif").sel(band=1).squeeze()
gdb_vml_polygs = 'RSA_VML_BUILDINGS_NI.gdb'
fc_vml_polygs = 'VML_Buildings_NI'
vml_polygs = gpd.read_file(gdb_vml_polygs, driver='FileGDB', layer=fc_vml_polygs)
out_xds = xds.copy()
for geom in vml_polygs.geometry.apply(mapping):
 clipped = xds.rio.clip([geom], vml_polygs.crs, drop=False)
 out_xds = out_xds.where(numpy.isnan(clipped), clipped.mean())
out_xds.rio.to_raster("out_averages.tif")
I tested it on this input raster:
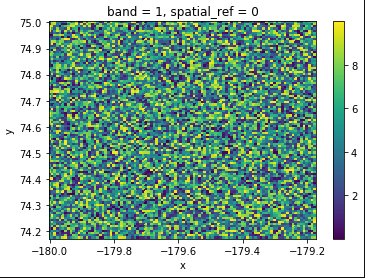
And with four regions to average over, this was the result:
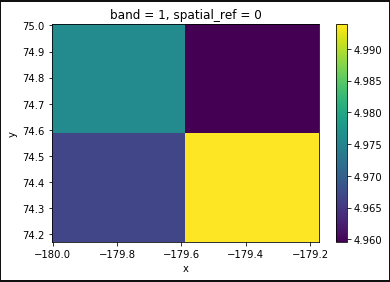
With rasterio
filled=False gives back masked array which can be utilised to replace with mean value.
Make sure to set crop=False and set the indexes to the band you want to replace it with.
import geopandas as gpd
import rasterio.mask
import rasterio as rio
gdf = gpd.read_file('input_shp.shp')
with rio.open("input.tif", "r") as src:
 band_num = 1
 src_image = src.read(band_num, out_dtype=rio.float64)
 # for each feature geom, replace with mean
 for geom in gdf.geometry:
 out_image, out_transform = rio.mask.mask(
 src, [geom], crop=False, filled=False, indexes=band_num
 )
 src_image[~out_image.mask] = src_image[~out_image.mask].mean()

 # save tif
 profile = src.profile
 profile.update(dtype=rio.float64, count=1, compress="lzw")
 with rasterio.open("output.tif", "w", **profile) as dst:
 dst.write(src_image, 1)
I recently undertook a very similar task and found that while the rasterio.mask.mask for-loop method worked, it was incredibly slow. Instead I suggest using rasterstats to populate a list of replacement values for each geometry which you want to burn into the raster, and then using rasterio.features.rasterize to burn the values in. This led to a 1000 improvement in performance for my application.
import geopandas as gpd
import rasterio
import rasterstats
raster = `` # this is a string filepath to a raster
output_raster = `` # this is a string filepath to the output raster
geoms = gpd.read_file('') # Insert a filepath to the vector file you want to use
values = rasterstats.zonal_stats( geoms, dem, stats = 'min' ) # Choose whatever stats you want to use
geoms['replacement_value'] = [i['min'] for i in values] # Replace 'min' as needed
geoms_zip = zip( geoms.geometry.values, geoms.replacement_value.value) # Create an iterable for rasterio.features.rasterize shape variable
with rasterio.open(raster, "r") as src:
 band_num = 1
 src_image = src.read( band_num )
 raster_replace = rasterio.features.rasterize( geoms_zip, out = src_image,
 transform = src.transform,
 all_touched = True )
 # save tif
 profile = src.profile
 profile.update( dtype= src.meta['dtype'], count = 1, compress = "lzw" )
 with rasterio.open( output_raster, "w", **profile ) as dst:
 dst.write( raster_replace, 1 )
rasteriobut as far as I know, it runs on top ofgdal. That means that there is a chance their.write()method accepts an offset as well. You could take a look at the documentation or tweak around with the.write()method to see if its possible.