I want to use this data set (publicly available for R)
library(R2BayesX)
library(spBayesSurv)
data("LeukSurv")
Observations: 1,043
Variables: 9
$ time <int> 1, 1, 1, 1, 1, 1, 1, 1, 1, 1, 1, 1, 1, 1, 1, 1, 1, 1
$ cens <int> 1, 1, 1, 1, 1, 1, 1, 1, 1, 1, 1, 1, 1, 1, 1, 1, 1, 1
$ xcoord <dbl> 0.20507166, 0.28555678, 0.17640573, 0.24476295,
$ ycoord <dbl> 0.49724366, 0.84895259, 0.73649394, 0.21058434,
$ age <int> 61, 76, 74, 79, 83, 81, 76, 87, 66, 78, 57, 87, 79, 84
$ sex <dbl> 0, 0, 0, 1, 1, 1, 0, 0, 0, 1, 0, 1, 1, 0, 0, 1, 0, 1
$ wbc <dbl> 13.3, 450.0, 154.0, 500.0, 160.0, 30.4, 41.3,
$ tpi <dbl> -1.96, -3.39, -4.95, -1.40, -2.59, 0.03, 3.95, 1.91
$ district <int> 9, 7, 7, 24, 7, 11, 17, 21, 18, 7, 17, 9
and there is a boundry file for this data set
> nwengland <- read.bnd(system.file("otherdata/nwengland.bnd", package = "spBayesSurv"))
Read 25774 records
Note: map consists of 29 polygons
Note: map consists of 24 regions
Reading map ... finished
I want to combine these two as SpatialPolygonDataFrame so I can use errorsarlm() or lagsarlm() any other spatial R code which needs listw=()
I think we can use district to do this but I couldn't find how. I believe proj4string for north west england is "+proj=tmerc +lat_0=49 +lon_0=-2 +k=0.9996012717 +x_0=400000 +y_0=-100000 +ellps=airy +datum=OSGB36 +units=m +no_defs"
BTW: Data frame to SpatialPolygonsDataFrame with multiple polygons doesn't work
@spacedman gave me an idea and tried to do this:
> pcens = SpatialPolygonsDataFrame(nwsp,
 aggregate(LeukSurv,
 list(d=LeukSurv$district),
 function(v){LeukSurv}))
What I am trying to do is that I want to add each information to comes from each county to spatial polygon and make it spatial polygon data frame. Is it possible?
PS: I couldn't make it working.
-
I deleted the "spatial-statistics" tag because this has nothing to do with spatial statistics. This is the second time I have done this. Tags are important in searching for relevant information on this site. As such, please be mindful that the tags represent the topic at hand. Your question is only transcendentally related to the errorsarlm() or lagsarlm() functions and this does not make it a spatial statistics question.Jeffrey Evans– Jeffrey Evans2019年04月03日 17:17:05 +00:00Commented Apr 3, 2019 at 17:17
-
"Spatial analysis or spatial statistics includes any of the formal techniques which study entities using their topological, geometric, or geographic properties" this is the definition of spatial statistics on wiki. When I was using the tag, I was using based on this impression. Additionally, I am not sure how this is tag negatively effecting you if it was used wrong (which I don't think i used it wrong). Thank you for your time removing and responding.iHermes– iHermes2019年04月03日 17:22:52 +00:00Commented Apr 3, 2019 at 17:22
-
There is actually a specialized field of statistics that focuses on spatial data that is formally referred to as "spatial statistics". It is not a catch-all term that characterizes any operation on spatial data This question focuses on data processing operations and not quantifying spatial structure/process or any type of statistical model. The operative term here is "statistics" and you are generalizing what the wiki is saying. Tags are used in searching the site for relevant information and incorrect tags cause erroneous search results.Jeffrey Evans– Jeffrey Evans2019年04月03日 18:03:01 +00:00Commented Apr 3, 2019 at 18:03
1 Answer 1
Convert the
bndobject to anspobject usingbnd2spfrom theR2BayesXpackage.Join data from the
LeukSurvdata frame using theregionvariable as the row number in thespobject.You don't need to do anything with coordinate systems. The data are scaled to an approximate unit square and there's no need to georeference them for an analysis.
There's more rows in the
LeukSurvthan in thebndobject so either extract parts of it or compute summaries depending on what you want to do.Compute the weights matrix for
errorsarlmetc using the functions inspdep.All the above operations are well documented elsewhere.
Oh okay here's an example...
> nwsp = bnd2sp(nwengland)
that makes an sp object.
Now I'm going to count the proportion of censored data in each district. I'm using aggregate here, and I've checked that it returns a data frame with increasing region number.
> pcens = SpatialPolygonsDataFrame(nwsp,
 aggregate(LeukSurv$cens,
 list(d=LeukSurv$district),
 function(v){mean(v)}))
And I can plot it:
> spplot(pcens,"x")
>
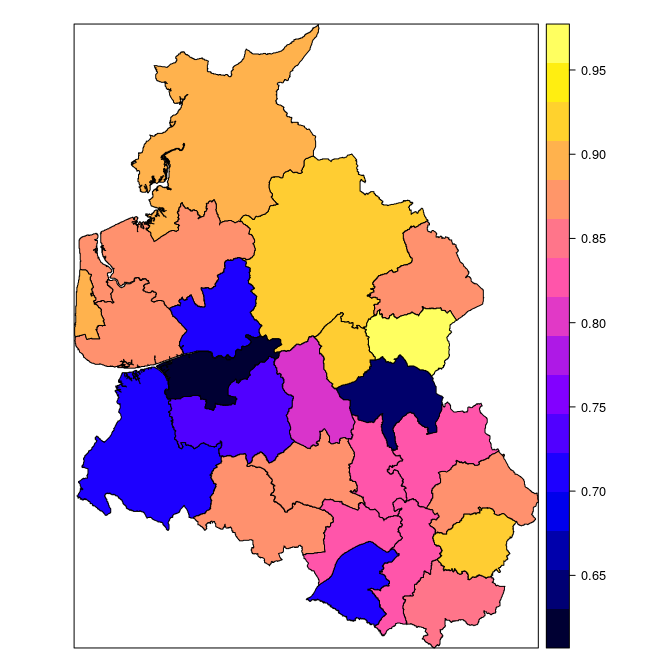
-
You are likely already aware of this but, I received an email from Bivand this morning indicating that he is splitting spdep into two packages, one focused on handling autocorrelation and spatial weights (spdep) and spatialreg (forthcoming on CRAN) focusing on active development of model fitting. In the next release, there will be many functions depreciate in spdep and moved to spatialreg.Jeffrey Evans– Jeffrey Evans2019年04月03日 18:11:49 +00:00Commented Apr 3, 2019 at 18:11