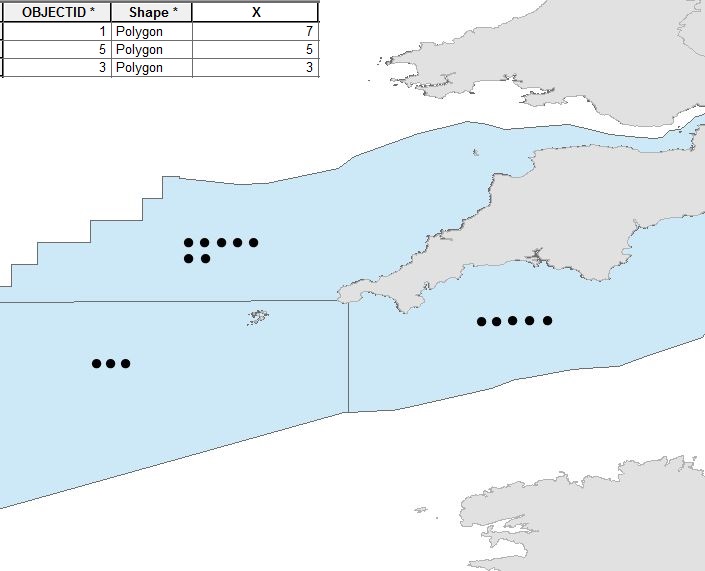
I am using ArcGIS 10.2.2 Advanced. I want to produce a map where the value of attributes in each polygon is shown by a representative number of symbols in each polygon. I have used Quantities> Dot Density, but this assigns the dots to randomised locations within the polygon and I want the symbols to be adjacent to each other as in the example picture attached. Preferably, I would like a solution which allows me to change the dot to a vector symbol of choice as well. I have searched through Stack Exchange and online, but haven't found a way to do this. Has anyone else figured out a way of doing this in ArcGIS? enter image description here
1 Answer 1
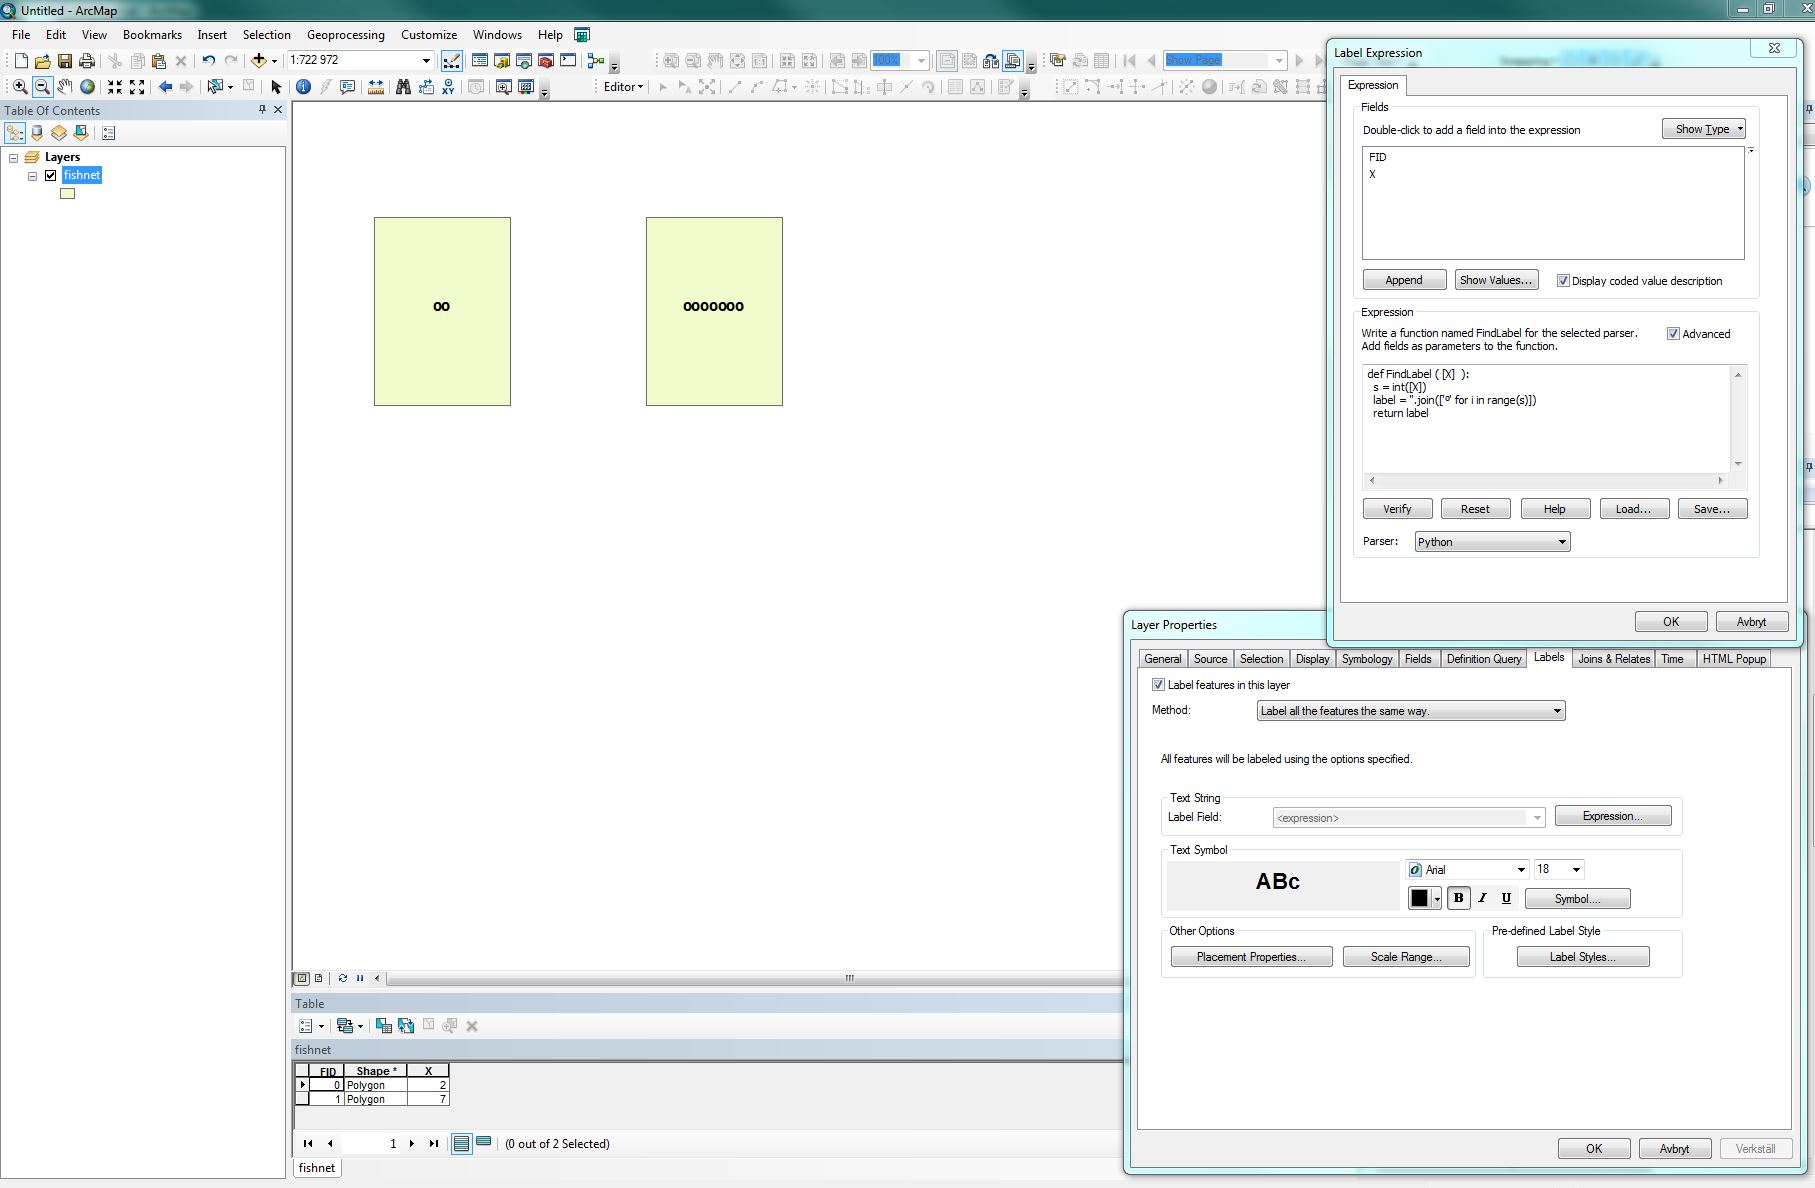
Use a label expression with Python parser. Replace o with whatever character you want to use:
def FindLabel ([X]):
 s = int([X])
 label = ''.join(['o' for i in range(s)])
 return label
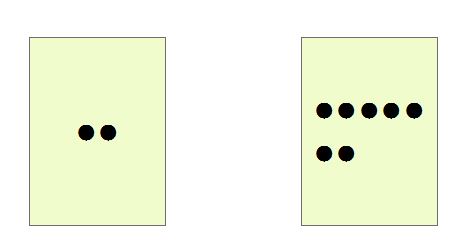
To get a line break every fifth charachter try:
def FindLabel ( [X] ):
 s = int([X])
 label = ['●くろまる' for i in range(s)]
 i = 5
 while i < len(label):
 label.insert(i, "\r\n")
 i += 6
 return ''.join(label)
Explore related questions
See similar questions with these tags.