enter image description hereI have a CSV file with following fields:
- Nodename
- Nodeid
- Latitude
- Longtitude
- Elevation
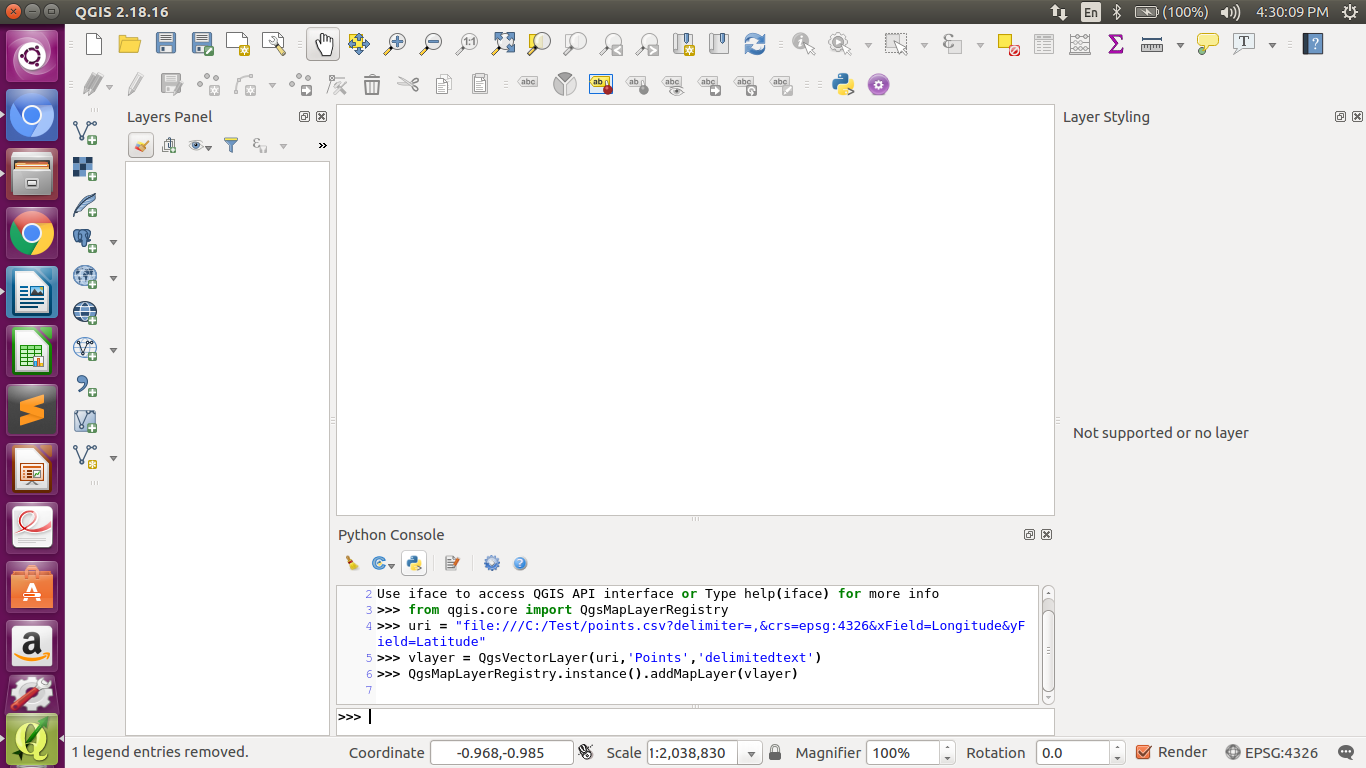
I am using Python console in QGIS to automate this. How should I write so that point with latitude, longtitude and elevation are maked as point layer? I have tried with below code, but I am getting error.
uri = "/home/priti/Desktop/MTP work/nodeinput.csv?\
type=csv&xField=Longtitude\
&yField=Lattitude\
&spatialIndex=no&subsetIndex=no&watchFile=no"
vlayer = QgsVectorLayer(uri, 'Nodes', "delimitedtext")
-
What error message do you get?Bera– Bera2018年08月21日 10:10:33 +00:00Commented Aug 21, 2018 at 10:10
-
SyntaxError: EOL while scanning string literalps1– ps12018年08月21日 10:13:38 +00:00Commented Aug 21, 2018 at 10:13
-
If you screenshot is showing what you are doing of course it will not work. You need to change path to file+filename and the name of lat and long fieldBera– Bera2018年08月21日 11:04:38 +00:00Commented Aug 21, 2018 at 11:04
-
I didnt get you .ps1– ps12018年08月21日 11:06:12 +00:00Commented Aug 21, 2018 at 11:06
-
I am woking on Ubuntu system . There is no such C drive here i thinkps1– ps12018年08月21日 11:08:39 +00:00Commented Aug 21, 2018 at 11:08
3 Answers 3
Try:
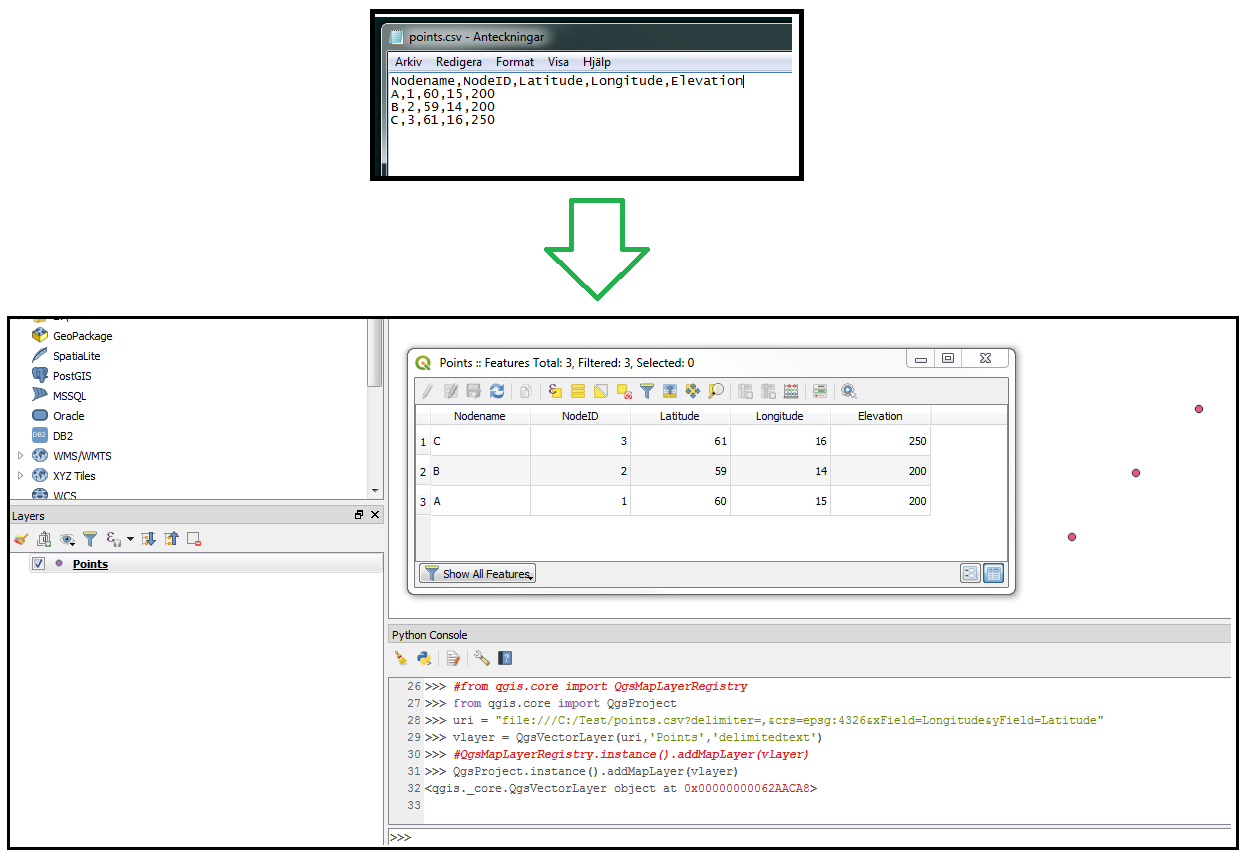
from qgis.core import QgsMapLayerRegistry #Qgis2
#from qgis.core import QgsProject #QGIS3
uri = "file:///C:/Test/points.csv?delimiter=,&crs=epsg:4326&xField=Longitude&yField=Latitude"
vlayer = QgsVectorLayer(uri,'Points','delimitedtext')
QgsMapLayerRegistry.instance().addMapLayer(vlayer) #Qgis2
#QgsProject.instance().addMapLayer(vlayer) #QGIS3
answered Aug 21, 2018 at 10:20
-
QgsProject' object has no attribute 'addMapLayer' Getting this Errorps1– ps12018年08月21日 10:22:26 +00:00Commented Aug 21, 2018 at 10:22
-
Yeah This time there was no error, but i cant see pointsps1– ps12018年08月21日 10:30:12 +00:00Commented Aug 21, 2018 at 10:30
-
any idea ? why i cant see points :(ps1– ps12018年08月21日 10:37:00 +00:00Commented Aug 21, 2018 at 10:37
-
Do you get the 'Points' layer in Layers tree? Is the attribute table empty?Bera– Bera2018年08月21日 10:39:02 +00:00Commented Aug 21, 2018 at 10:39
-
You say you are trying with the python console, but if you want to try with stand alone python, this does the trick:
import fiona
from shapely.geometry import Point, mapping
import csv
driver = 'ESRI Shapefile'
schema = {'geometry': 'Point', 'properties' : {'Nodename': 'str', 'Nodeid': 'int'}}
pointlayer = fiona.open("test.shp", 'w', driver=driver, schema=schema)
with open("test.csv") as f:
 reader = csv.reader(f)
 next(reader) # skip header
 for row in reader:
 geom = Point(int(row[2]), int(row[3]), int(row[4])) # Considering the order of elements that you gave
 pointlayer.write({'geometry': mapping(geom), 'properties': {'Nodename': row[0], 'Nodeid': row[1]}})
pointlayer.close()
answered Aug 21, 2018 at 10:24
Skip QGIS and go directly to OGR2OGR.
https://www.gdal.org/drv_csv.html use -lco X_POSSIBLE_NAMES="" -lco Y_POSSIBLE_NAMES=
ogr2ogr airports.shp airports.csv -dialect sqlite -sql "SELECT MakePoint(CAST(longitude as REAL), CAST(latitude as REAL), 4326) Geometry, * FROM airports"
answered Aug 21, 2018 at 15:08
lang-py