Submitting for expert review.
I am trying to create a Chart - Crosshair cursor in excel chart sheet. Chart - Crosshair cursor lines are two lines (one horizontal and other vertical) moving along with the cursor/pointer/mousemove on the chart. Most of the stock market online charts have such interactive tool. I have referred to many webpages such as Calculating datapoint position with chart mouseover event
Everyone concerned faced the same problem as I did - Calulation of exact cursor position coordinates as the chart is measured in points and cursor position (windows item) is measured in pixels. Somehow, I could calculate it with formula. (Very Close)
I understood cursor position coordinates are determined by following factors.
- Windows Zoom set by "Make everything bigger" option in control panel/ settings. In Excel this can be determined using (ActiveWindow.Width)
- Page Size of the Chartsheet (ActiveChart.PageSetup.PaperSize)
- Page Orientation of the Chartsheet(ActiveChart.PageSetup.Orientation )
- Zoom percent of the chartsheet (ActiveWindow.Zoom)
- Chart area size (ChartArea.Width and ChartArea.Height)
for reference YouTube video. Please note that page margins are set to zero
Paste this code in excel VBE Chart(Sheet) object.
Option Explicit
Private xPoint As Variant, yPoint As Variant, XMax As Variant, YMax As Variant, DispScale As Variant
Private shp As Shape, ChartPaperSize, PgWidPXL, PgHgtPXL, ChtAreaWid, ChtAreaHgt, ActWinZoom
Private shpHL As Variant, shpVL As Variant
'--------------------------------------------------------------------------------
Private Sub Chart_MouseMove(ByVal Button As Long, ByVal Shift As Long, ByVal A As Long, ByVal B As Long)
'Dim xPoint As Variant, yPoint As Variant, XMax As Variant, YMax As Variant, DispScale As Variant
'Dim shp As Shape, ChartPaperSize, PgWidPXL, PgHgtPXL, ChtAreaWid, ChtAreaHgt, ActWinZoom
'This macro is suitable for following 4 paper sizes only
'--------------------------------------------------------------------------------
ChartPaperSize = ActiveChart.PageSetup.PaperSize
Select Case ChartPaperSize
' I couldnt find better way to convert paper size number to inches and therafter to pixels
' I dont know why multiplying by 0.9745 or 0.9725 keeps the x, y coordinates more close to the diplayed cursor position
 Case 5 '"xlPaperLegal"
 If ActiveChart.PageSetup.Orientation = xlLandscape Then
 PgWidPXL = 14 * 220 * 0.9745 '220 PPI
 PgHgtPXL = 8.5 * 220 * 0.9725
 Else
 PgWidPXL = 8.5 * 220 * 0.9745
 PgHgtPXL = 14 * 220 * 0.9725
 End If
 Case 1 '"xlPaperLetter"
 If ActiveChart.PageSetup.Orientation = xlLandscape Then
 PgWidPXL = 11 * 220 * 0.9745
 PgHgtPXL = 8.5 * 220 * 0.9725
 Else
 PgWidPXL = 8.5 * 220 * 0.9745
 PgHgtPXL = 11 * 220 * 0.9725
 End If
 Case 9 '"xlPaperA4"
 If ActiveChart.PageSetup.Orientation = xlLandscape Then
 PgWidPXL = 11.69 * 220 * 0.9745
 PgHgtPXL = 8.27 * 220 * 0.9725
 Else
 PgWidPXL = 8.27 * 220 * 0.9745
 PgHgtPXL = 11.69 * 220 * 0.9725
 End If
 Case 8 ' "xlPaperA3"
 If ActiveChart.PageSetup.Orientation = xlLandscape Then
 PgWidPXL = 16.54 * 220 * 0.9745
 PgHgtPXL = 11.69 * 220 * 0.9725
 Else
 PgWidPXL = 11.69 * 220 * 0.9745
 PgHgtPXL = 16.54 * 220 * 0.9725
 End If
 'Case Else
End Select
'Windows display recommended scale of 125% in my computer settings
XMax = PgWidPXL * (100 / 125) ' for A4 2503 for legal 2999 '2395 'Max mousepointer width on 100% chart sheet zoom
YMax = PgHgtPXL * (100 / 125) ' for A4 1764 for legal 1814 '1450 'Max mousepointer height on 100% chart sheet zoom
ChtAreaWid = ChartArea.Width
ChtAreaHgt = ChartArea.Height
DispScale = Round(1161 / ActiveWindow.Width, 2)
' 1161 is ActiveWindow.Width at Windows display recommended scale of 125% on my computer
ActWinZoom = ActiveWindow.Zoom
xPoint = (A * (ChtAreaWid * DispScale) / XMax) / (ActWinZoom / 100)
yPoint = (B * (ChtAreaHgt * DispScale) / YMax) / (ActWinZoom / 100)
'--------------------------------------------------------------------------------
'Delete lines
For Each shp In ActiveChart.Shapes
If shp.Type = msoLine Then
shp.Delete
End If
Next
'Add new lines
With ActiveChart.Shapes.AddLine(1, yPoint, ChartArea.Width, yPoint).Line 'horizontal line
.ForeColor.RGB = RGB(150, 150, 150)
.Weight = 5
End With
With ActiveChart.Shapes.AddLine(xPoint, 1, xPoint, ChartArea.Height).Line 'vertical line
.ForeColor.RGB = RGB(150, 150, 150)
.Weight = 5
End With
'--------------------------------------------------------------------------------
'Above deletion and addition of new lines could be avoided if two lines are already present
'Say, we manually insert line shapes named "Straight Connector 1" and "Straight Connector 2" then
'With ActiveChart.Shapes("Straight Connector 1") 'horizontal line
'.Left = 1
'.Top = yPoint
'.Width = ChartArea.Width
'.Height = 1
'End With
'With ActiveChart.Shapes("Straight Connector 2") 'vertical line
'.Left = xPoint
'.Top = 1
'.Width = 1
'.Height = ChartArea.Height
'End With
'--------------------------------------------------------------------------------
End Sub
Code works fine. I was wondering if we can avoid deletion and addition of lines with every mouse move. I tried adding lines on chart activate event and then allign those lines using module level variables. But the too procedures cannot work together as by the time chart activate is triggered mouse move already takes place. Any suggestions?
-
2\$\begingroup\$ "Refer YouTube video" Links can rot. Please tell us the purpose of the code in the question itself, so the question is still valid without the link. \$\endgroup\$Mast– Mast ♦2020年06月23日 07:24:50 +00:00Commented Jun 23, 2020 at 7:24
-
\$\begingroup\$ @Mast Added first paragraph. Please see. Thanks for guidance. \$\endgroup\$Naresh– Naresh2020年06月23日 07:38:46 +00:00Commented Jun 23, 2020 at 7:38
-
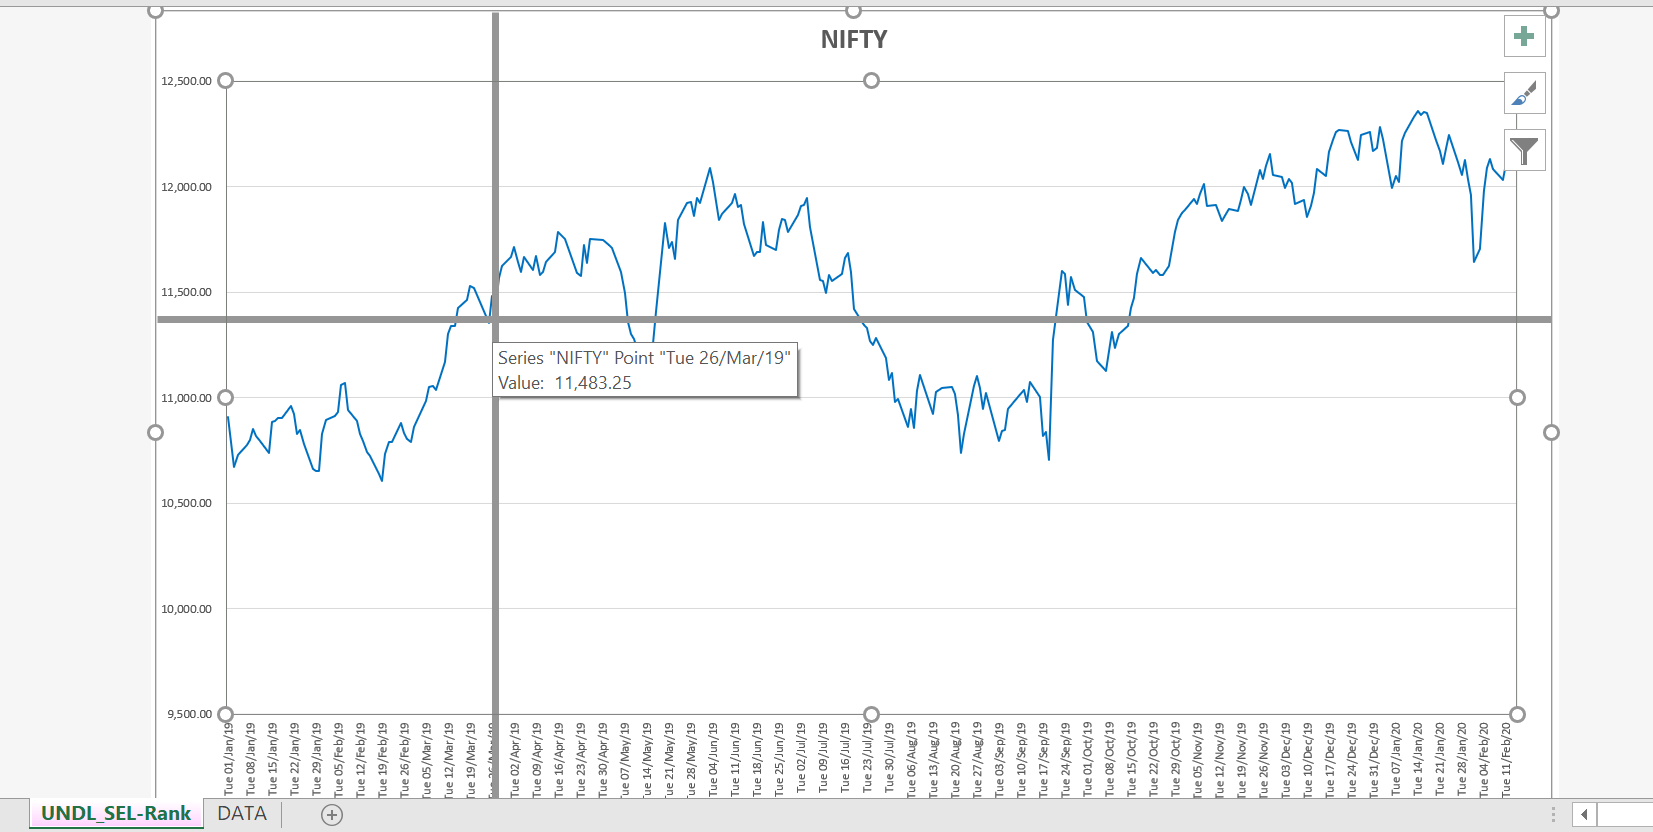
\$\begingroup\$ Margins in the above chart are set to zero .. Also, noticed this OLD page today :) \$\endgroup\$Naresh– Naresh2021年06月26日 05:08:00 +00:00Commented Jun 26, 2021 at 5:08
-
\$\begingroup\$ One can Use MouseDown event instead of MouseMove event to avoid continuous deletion and addition of lines with every mouse move. \$\endgroup\$Naresh– Naresh2021年06月26日 07:22:06 +00:00Commented Jun 26, 2021 at 7:22
1 Answer 1
After visiting this link, thought of adding extra two xlXYScatterLines series.
https://chandoo.org/forum/threads/interactive-excel-charts-crosshair.3523/post-17715
Whenever a value series is clicked, the series points at the cursor are captured in variables and both the xlXYScatterLines series are updated.
Option Explicit
'https://chandoo.org/forum/threads/interactive-excel-charts-crosshair.3523/post-17715
'https://codereview.stackexchange.com/a/274401/218583
Private Sub Chart_Mousedown(ByVal Button As Long, ByVal Shift As Long, _
 ByVal x As Long, ByVal y As Long)
Data_Points x, y
End Sub
Private Sub Data_Points(ByVal x As Long, ByVal y As Long)
Dim ElementID As Long, SrNum As Long, SrName As String, SrPointNum As Long
Dim Newtitle As String, xVals, yVals, SrAx, CHVYVal
Dim CHH As Series, CHV As Series
Me.GetChartElement x, y, ElementID, SrNum, SrPointNum
If ElementID = xlSeries Then
 If SrPointNum <> -1 Then
 With Me.SeriesCollection(SrNum)
 SrName = .Name
 yVals = .Values
 xVals = .XValues
 SrAx = .AxisGroup
 If SrName <> "CHH" And SrName <> "CHV" Then
 Newtitle = .Name & ": " & yVals(SrPointNum) & " @" & _
 CDate(xVals(SrPointNum))
 Else
 Newtitle = Me.ChartTitle.Text
 End If
 End With

 End If
 'adding chart series CHH (CrossHair Horizontal) and CHV (Vertical)
 On Error Resume Next
 If Me.SeriesCollection("CHH") Is Nothing Then
 Set CHH = Me.SeriesCollection.NewSeries
 CHH.Name = "CHH"
 Else
 Set CHH = Me.SeriesCollection("CHH")
 End If

 If Me.SeriesCollection("CHV") Is Nothing Then
 Set CHV = Me.SeriesCollection.NewSeries
 CHV.Name = "CHV"
 Else
 Set CHV = Me.SeriesCollection("CHV")
 End If
 On Error GoTo 0

 'scaling CHH and CHV series and adding data labels to CHH
 With CHH
 .XValues = Array(LBound(xVals), UBound(xVals))
 .Values = Array(yVals(SrPointNum), yVals(SrPointNum))
 .AxisGroup = SrAx
 .ChartType = xlXYScatterLinesNoMarkers
 If .HasDataLabels = False Then
 .ApplyDataLabels
 With .DataLabels
 .NumberFormat = "#,##0.00"
 .Position = xlLabelPositionCenter
 With .Format.Fill
 .Visible = msoTrue
 .ForeColor.ObjectThemeColor = msoThemeColorText1
 End With
 With .Format.TextFrame2.TextRange.Font
 .Fill.Visible = msoTrue
 .Fill.ForeColor.ObjectThemeColor = msoThemeColorBackground1
 .Bold = msoTrue
 End With
 End With
 End If
 End With

 CHVYVal = Array(Me.Axes(xlValue, xlPrimary).MinimumScale, _
 Me.Axes(xlValue, xlPrimary).MaximumScale)

 With CHV
 .XValues = Array(SrPointNum, SrPointNum)
 .Values = CHVYVal
 .ChartType = xlXYScatterLinesNoMarkers
 .AxisGroup = xlPrimary
 End With

 'Adding/ updating chart title with series value
 On Error Resume Next
 If Me.HasTitle = False Then
 Me.SetElement (msoElementChartTitleAboveChart)
 End If
 Me.ChartTitle.Text = Newtitle
 On Error GoTo 0
End If
End Sub