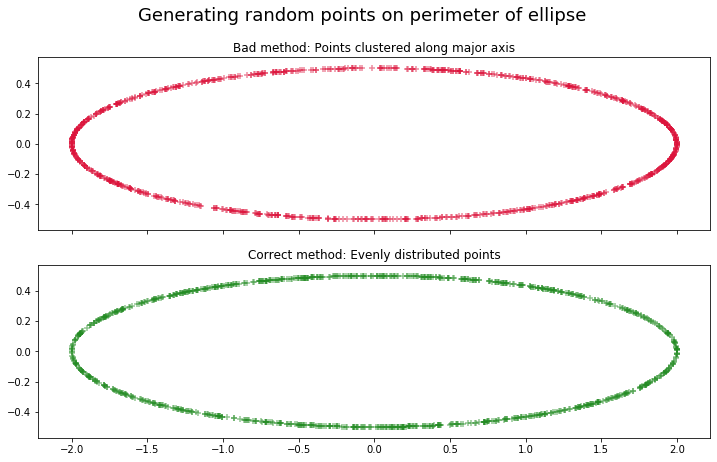
Following the method suggested here, I've written a Python script that generates random points along the perimeter of an ellipse. I wanted to compare a "naive" method (which fails to produce an even distribution) with the correct method, which works like this:
- Numerically compute P, the perimeter of the ellipse.
- Pick a random number s on [0,P].
- Determine the angle t associated with that arc length s.
- Compute the x- and y-coordinates associated with t from the parametric form of the ellipse.
Here is the code I am hoping to receive feedback on. I ran it through flake8 already.
import numpy as np
import matplotlib.pyplot as plt
def ellipse_arc(a, b, theta, n):
 """Cumulative arc length of ellipse with given dimensions"""
 # Divide the interval [0 , theta] into n steps at regular angles
 t = np.linspace(0, theta, n)
 # Using parametric form of ellipse, compute ellipse coord for each t
 x, y = np.array([a * np.cos(t), b * np.sin(t)])
 # Compute vector distance between each successive point
 x_diffs, y_diffs = x[1:] - x[:-1], y[1:] - y[:-1]
 cumulative_distance = [0]
 c = 0
 # Iterate over the vector distances, cumulating the full arc
 for xd, yd in zip(x_diffs, y_diffs):
 c += np.sqrt(xd**2 + yd**2)
 cumulative_distance.append(c)
 cumulative_distance = np.array(cumulative_distance)
 # Return theta-values, distance cumulated at each theta,
 # and total arc length for convenience
 return t, cumulative_distance, c
def theta_from_arc_length_constructor(a, b, theta=2*np.pi, n=100):
 """
 Inverse arc length function: constructs a function that returns the
 angle associated with a given cumulative arc length for given ellipse."""
 # Get arc length data for this ellipse
 t, cumulative_distance, total_distance = ellipse_arc(a, b, theta, n)
 # Construct the function
 def f(s):
 assert np.all(s <= total_distance), "s out of range"
 # Can invert through interpolation since monotonic increasing
 return np.interp(s, cumulative_distance, t)
 # return f and its domain
 return f, total_distance
def rand_ellipse(a=2, b=0.5, size=50, precision=100):
 """
 Returns uniformly distributed random points from perimeter of ellipse.
 """
 theta_from_arc_length, domain = theta_from_arc_length_constructor(a, b, theta=2*np.pi, n=precision)
 s = np.random.rand(size) * domain
 t = theta_from_arc_length(s)
 x, y = np.array([a * np.cos(t), b * np.sin(t)])
 return x, y
def rand_ellipse_bad(a, b, n):
 """
 Incorrect method of generating points evenly spaced along ellipse perimeter.
 Points cluster around major axis.
 """
 t = np.random.rand(n) * 2 * np.pi
 return np.array([a * np.cos(t), b * np.sin(t)])
And some test visualizations:
np.random.seed(4987)
x1, y1 = rand_ellipse_bad(2, .5, 1000)
x2, y2 = rand_ellipse(2, .5, 1000, 1000)
fig, ax = plt.subplots(2, 1, figsize=(13, 7), sharex=True, sharey=True)
fig.suptitle('Generating random points on perimeter of ellipse', size=18)
ax[0].set_aspect('equal')
ax[1].set_aspect('equal')
ax[0].scatter(x1, y1, marker="+", alpha=0.5, color="crimson")
ax[1].scatter(x2, y2, marker="+", alpha=0.5, color="forestgreen")
ax[0].set_title("Bad method: Points clustered along major axis")
ax[1].set_title("Correct method: Evenly distributed points")
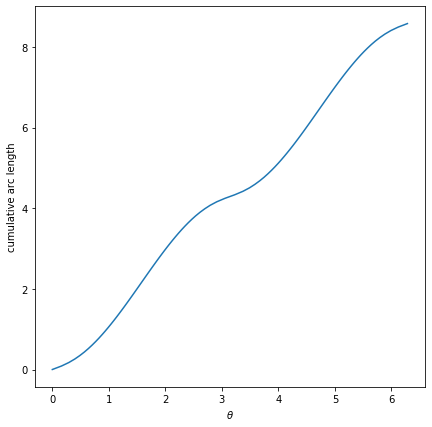
# Plot arc length as function of theta
theta_from_arc_length, domain = theta_from_arc_length_constructor(2, .5, theta=2*np.pi, n=100)
s_plot = np.linspace(0, domain, 100)
t_plot = theta_from_arc_length(s_plot)
fig, ax = plt.subplots(figsize=(7,7), sharex=True, sharey=True)
ax.plot(t_plot, s_plot)
ax.set_xlabel(r'$\theta$')
ax.set_ylabel(r'cumulative arc length')
I would appreciate a general review, but I also have a few specific questions:
- How are my comments? In my code, I know many of my comments are explaining "how" rather than "why," and my inclination is simply to remove them, since I think I have made my variable and function names clear. But I would appreciate an example of how a comment like
# Compute vector distance between each successive pointcould be rewritten in "why" terms. - Have I computed the arc length in the most efficient way possible? I started by generating the points in two lists of x- and y-coordinates, then iterated over these lists to get the distance made at each step, cumulating those distances as I went around.
- Is it there anything unconventional or inefficient about using
theta_from_arc_length_constructorto create the inverse arc-length function? My thinking was that I need to evaluate the inverse of the arc-length function for every s, so I should go ahead and "prepare" this function rather than recalculate the total arc length each time. But doesn'treturn np.interp(s, cumulative_distance, t)mean that numpy has to do the interpolation every time I call f ? Or does it get "automatically" vectorized because I feed it s as an array later on when creating the graphs?
2 Answers 2
Some small speed improvement. Instead of having a Python for loop in order to compute the total and cumulative sum, use the respective numpy functions. Same for the differences:
x_diffs, y_diffs = np.diff(x), np.diff(y)
delta_r = np.sqrt(x_diffs**2 + y_diffs**2)
cumulative_distance = delta_r.cumsum()
c = delta_r.sum()
-
\$\begingroup\$ Thank you! I was able to consolidate it a little more by using
np.linalg.normto get the deltas, like so:coords = np.array([a * np.cos(t), b * np.sin(t)])coords_diffs = np.diff(coords)cumulative_distance = np.cumsum(np.linalg.norm(coords_diffs, axis=0)). Also, I had tonp.concatenatea 0 back onto thecumsumat the end so that it matches the size oft. \$\endgroup\$Max– Max2020年06月09日 23:13:40 +00:00Commented Jun 9, 2020 at 23:13
The intro you provided for this question is a good start on a module level comment or docstring that describes why the module is coded the way it is.
"""
This module generates random points on the perimeter of a ellipse.
The naive approach of picking a random angle and computing the
corresponding points on the ellipse results in points that are not
uniformly distributed along the perimeter.
This module generates points that are uniformly distributed
on the perimeter by:
 1. Compute P, the perimeter of the ellipse. There isn't a simple
 formula for the perimeter so it is calculated numerically.
 2. Pick a random number s on [0,P].
 3. Determine the angle t associated with the arc [0,s].
 4. Compute the x- and y-coordinates associated with t from the
 parametric equation of the ellipse.
"""
To respond to your comment, put the plotting code at the end of the file in a if __name__ == "__main__": guard (see docs). If you run the file as a script or using python -m it will run the plotting code. If the file is imported then this code is not included.
if __name__ == "__main__":
 import matplotlib.pyplot as plt
 np.random.seed(4987)

 x1, y1 = rand_ellipse_bad(2, .5, 1000)
 x2, y2 = rand_ellipse(2, .5, 1000, 1000)

 fig, ax = plt.subplots(2, 1, figsize=(13, 7), sharex=True, sharey=True)
 fig.suptitle('Generating random points on perimeter of ellipse', size=18)
 ax[0].set_aspect('equal')
 ax[1].set_aspect('equal')
 ax[0].scatter(x1, y1, marker="+", alpha=0.5, color="crimson")
 ax[1].scatter(x2, y2, marker="+", alpha=0.5, color="forestgreen")
 ax[0].set_title("Bad method: Points clustered along major axis")
 ax[1].set_title("Correct method: Evenly distributed points")
 # Plot arc length as function of theta
 theta_from_arc_length, domain = theta_from_arc_length_constructor(2, .5, theta=2*np.pi, n=100)
 s_plot = np.linspace(0, domain, 100)
 t_plot = theta_from_arc_length(s_plot)

 fig, ax = plt.subplots(figsize=(7,7), sharex=True, sharey=True)
 ax.plot(t_plot, s_plot)
 ax.set_xlabel(r'$\theta$')
 ax.set_ylabel(r'cumulative arc length')
-
\$\begingroup\$ Thank you. Where would this comment go in the file? Would I just put it at the top (before the imports)? And if I wanted to include my visualizations as a "usage example," is there a way to incorporate them into the same .py file? I have been doing everything in Jupyter notebook, so I'm used to having my separate markdown cells and this style of documentation is new to me. \$\endgroup\$Max– Max2020年06月11日 03:04:38 +00:00Commented Jun 11, 2020 at 3:04
-
\$\begingroup\$ Pep 8 says
importstatement come after module level comments; put it before the imports. I don't know of a generic portable way to include images in a python source file. But I think you can include them in Sphynx documentation, or put a URL in a comment. \$\endgroup\$RootTwo– RootTwo2020年06月11日 03:24:29 +00:00Commented Jun 11, 2020 at 3:24 -
\$\begingroup\$ I don't want to put the images themselves in, just the code used to generate them as a sort of "usage example." But perhaps I should come up with an example that doesn't involve matplotlib at all, since the main functions don't depend on it anyway. \$\endgroup\$Max– Max2020年06月11日 03:57:47 +00:00Commented Jun 11, 2020 at 3:57
-
\$\begingroup\$ @Max you could always put the plotting code in a
if __name__ == "__main__":guard. See revised answer. \$\endgroup\$RootTwo– RootTwo2020年06月11日 04:51:23 +00:00Commented Jun 11, 2020 at 4:51
mpmath.quadfor integration (example here) \$\endgroup\$