I have an input DataFrame with one row per product with balances, rates, etc. I want to be able to take that starting balance, and other inputs from the row (characteristics of the product), and forecast out 12 months of balances. What is the best approach to turn this one row per product information (there are a lot of individual products) and turn it into a summary forecast 12 months forward looking? The below is an example of one type of product that would have to be modelled.
The below code works, but I would like to know whether there is a better way overall to create forecasts with scenarios using python, pandas or numpy.
Code that gets me from one to the other:
Creates generator function that creates Ordered Dict, when called in pandas DataFrame outputs the example output.
EDIT: Added imports and sample dataframe
# Add relevant packages
import pandas as pd
pd.options.display.float_format = '{:.2f}'.format
import numpy as np
import datetime as dt
from collections import OrderedDict
from dateutil.relativedelta import relativedelta
%matplotlib inline
# SAMPLE DATA
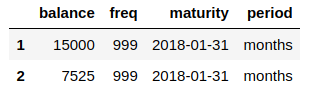
df = pd.DataFrame({
'balance': {1: 1500, 2: 700},
'freq': {1: 999, 2: 999},
'maturity': {1: '2018-01-31', 2: '2018-01-31'},
'period': {1: 'months', 2: 'months'},
})
def dmd_flow(balance, start_date, num_periods, run_off_rate, new_funds_rate, int_rate, period='monthly'):
"""
Implements the cash flow modeling for demand products
Arguments:
balance -- initial balance of product at t0
start_date -- calendar date of t0
num_periods -- number of period to model
run_off_rate -- annualized rate at which deposit runs off- straight line
new_funds_rate -- annualized rate at which funds increase (net)
int_rate -- rate paying on deposit which would be used if modeling interest payable
period -- the period used for modeling i.e. monthly, annual
Returns:
liq_sched -- a schedule of liquidity based on the inputs ordered by time (ordered dictionary)
"""
p=1
b_bal = balance
e_bal = balance
current_date = start_date
while p <= num_periods:
if period == 'monthly':
e_bal = round(b_bal - (balance*1/12*run_off_rate), 4)
e_bal += round((balance*1/12*new_funds_rate), 4)
if period == 'annual':
e_bal = round(b_bal - (balance*run_off_rate), 4)
e_bal += round((balance*new_funds_rate), 4)
yield(OrderedDict([('Month', current_date),
('Period', p),
('Beg Bal', b_bal),
('End Bal', e_bal),
]))
p += 1
current_date += relativedelta(months=+1, day=31)
b_bal = e_bal
def create_timeseries_df(input=None, func=None, args=(dt.date(2018,1,31), 0, 0, 0, 0, 'monthly')):
'''takes a series as an input and applies the fuctions to create the timeseries in the right shape'''
new_df = input['balance'].apply(
func, args=args)
return pd.DataFrame([o_dict for gen in new_df for o_dict in gen])
out_df = create_timeseries_df(df, func=dmd_flow, args=(dt.date(2018,1,31), 12, 0, .10, .03, 'monthly'))
out_df.groupby(['Month', 'Period'])[['Beg Bal', 'End Bal']].sum()
Example input DF (can use sample DF included above, and run in order to get the resulting output:
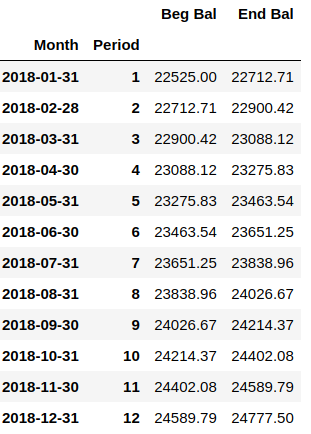
Example Output Created using code:
-
1\$\begingroup\$ Could you include all the imports and paste example dataframes as text, please? \$\endgroup\$Georgy– Georgy2018年02月10日 17:08:29 +00:00Commented Feb 10, 2018 at 17:08
-
\$\begingroup\$ @Georgy Hi. Added imports and sample DF. \$\endgroup\$ivan7707– ivan77072018年02月10日 17:41:22 +00:00Commented Feb 10, 2018 at 17:41
-
\$\begingroup\$ @Graipher, hi, you probably missed the data is at the bottom of the code sample under # SAMPLE DATA \$\endgroup\$ivan7707– ivan77072018年02月10日 23:03:05 +00:00Commented Feb 10, 2018 at 23:03
-
1\$\begingroup\$ @Graipher Thanks. I reworked the question to make it flow better when reading. \$\endgroup\$ivan7707– ivan77072018年02月11日 16:04:20 +00:00Commented Feb 11, 2018 at 16:04
1 Answer 1
The most confusing part in your code is that new_df in create_timeseries_df is actually a pd.Series full of generators! It took me a while to understand what is actually going on there. What was the point of using them in the first place? I don't think you win anything from it.
I also don't understand what was the point in using OrderedDict. Usual dict should be enough.
p=1
while p <= num_periods:
 ...
 p += 1
This is not a Pythonic way. Instead you should do it like this:
for p in range(num_periods):
 ... # Don't forget that p will start from 0, not 1
if period == 'monthly':
 e_bal = round(b_bal - (balance*1/12*run_off_rate), 4)
 e_bal += round((balance*1/12*new_funds_rate), 4)
if period == 'annual':
 e_bal = round(b_bal - (balance*run_off_rate), 4)
 e_bal += round((balance*new_funds_rate), 4)
No need to repeat twice. No need to repeat twice. For example, if you decide to change precision from 4 to 5 then you have to change it in 4 places! See "Why is DRY important?" for explanations why such code is bad. I suggest to rewrite it to something like this (not sure about the dict with coefficients though):
term_coefficients = {'monthly': 1 / 12,
 'annual': 1.}
precision = 4
...
coefficient = term_coefficients[period]
e_bal = round(b_bal + balance * coefficient * (new_funds_rate - run_off_rate),
 ndigits=precision)
Actually you don't need dateutil.relativedelta to get desired timeseries. Pandas already has this kind of functionality. Check this out:
pd.DataFrame({'Month': pd.date_range(start=start_date,
 periods=periods_count,
 freq='M')})
Your column Period is actually just an index column + 1:
some_df['Period'] = some_df.index + 1
I don't know if you really need this column at all because you already have column 'Month' that you can use for grouping data.
So, I decided to refactor your code. I split the logic in several functions in a different way than you did. I added type hints and changed format of a docstring to reST (see list of different formats). Unfortunately, I have no idea how to name the functions and some variables. It's up to you to name them properly.
If you have any questions, I will add explanations to my answer.
import datetime as dt
from typing import List
import pandas as pd
pd.options.display.float_format = '{:.2f}'.format
TERM_COEFFICIENTS = dict(monthly=1 / 12,
 annual=1.)
def get_final_result(*,
 balances: List[float],
 start_date: dt.date,
 periods_count: int,
 new_funds_rate: float,
 run_off_rate: float,
 precision: int = 4.,
 term: str = 'monthly'):
 """
 Implements the cash flow modeling for demand products
 :param balances: initial balances of product at t0
 :param start_date: calendar date of t0
 :param periods_count: number of period to model
 :param run_off_rate: annualized rate
 at which deposit runs off - straight line
 :param new_funds_rate: annualized rate
 at which funds increase (net)
 :param term: the period used for modeling
 i.e. monthly, annual
 :param precision: number of digits in final balance
 :return: a schedule of liquidity
 based on the inputs ordered by time
 """
 output_df = pd.DataFrame()
 for balance in balances:
 df = get_df(balance=balance,
 start_date=start_date,
 periods_count=periods_count,
 new_funds_rate=new_funds_rate,
 run_off_rate=run_off_rate,
 precision=precision,
 term=term)
 output_df = output_df.append(df)
 return output_df.groupby(
 ['month', 'period'])[['start_balance', 'end_balance']].sum()
def get_df(*,
 balance: float,
 start_date: dt.date,
 periods_count: int,
 run_off_rate: float,
 new_funds_rate: float,
 precision: int,
 term: str) -> pd.DataFrame:
 df = pd.DataFrame(dict(month=pd.date_range(start=start_date,
 periods=periods_count,
 freq='M')))
 df['period'] = df.index + 1
 terms_balances = get_balances(balance,
 periods_count=periods_count,
 term_coefficient=TERM_COEFFICIENTS[term],
 run_off_rate=run_off_rate,
 new_funds_rate=new_funds_rate,
 precision=precision)
 df['start_balance'] = terms_balances[:-1]
 df['end_balance'] = terms_balances[1:]
 return df
def get_balances(balance: float,
 *,
 periods_count: int,
 term_coefficient: float,
 run_off_rate: float,
 new_funds_rate: float,
 precision: int) -> List[float]:
 balances = [balance]
 for _ in range(periods_count):
 balances.append(round(get_end_balance(
 balance,
 start_balance=balances[-1],
 term_coefficient=term_coefficient,
 run_off_rate=run_off_rate,
 new_funds_rate=new_funds_rate),
 ndigits=precision))
 return balances
def get_end_balance(balance: float,
 *,
 start_balance: float,
 term_coefficient: float,
 run_off_rate: float,
 new_funds_rate: float) -> float:
 return (balance * term_coefficient * (new_funds_rate - run_off_rate)
 + start_balance)
if __name__ == '__main__':
 data = pd.DataFrame({
 'balance': {
 1: 1500,
 2: 700},
 'freq': {
 1: 999,
 2: 999},
 'maturity': {
 1: '2018-01-31',
 2: '2018-01-31'},
 'period': {
 1: 'months',
 2: 'months'},
 })
 print(get_final_result(balances=data['balance'].tolist(),
 start_date=dt.date(2018, 1, 31),
 periods_count=12,
 run_off_rate=0.,
 new_funds_rate=0.1,
 precision=4))
-
1\$\begingroup\$ Thanks @Georgy, I was trying to piece together a some ideas I got for a couple of different resources. I appreciate you taking your time. It was helpful to see your approach. \$\endgroup\$ivan7707– ivan77072018年02月13日 04:34:01 +00:00Commented Feb 13, 2018 at 4:34