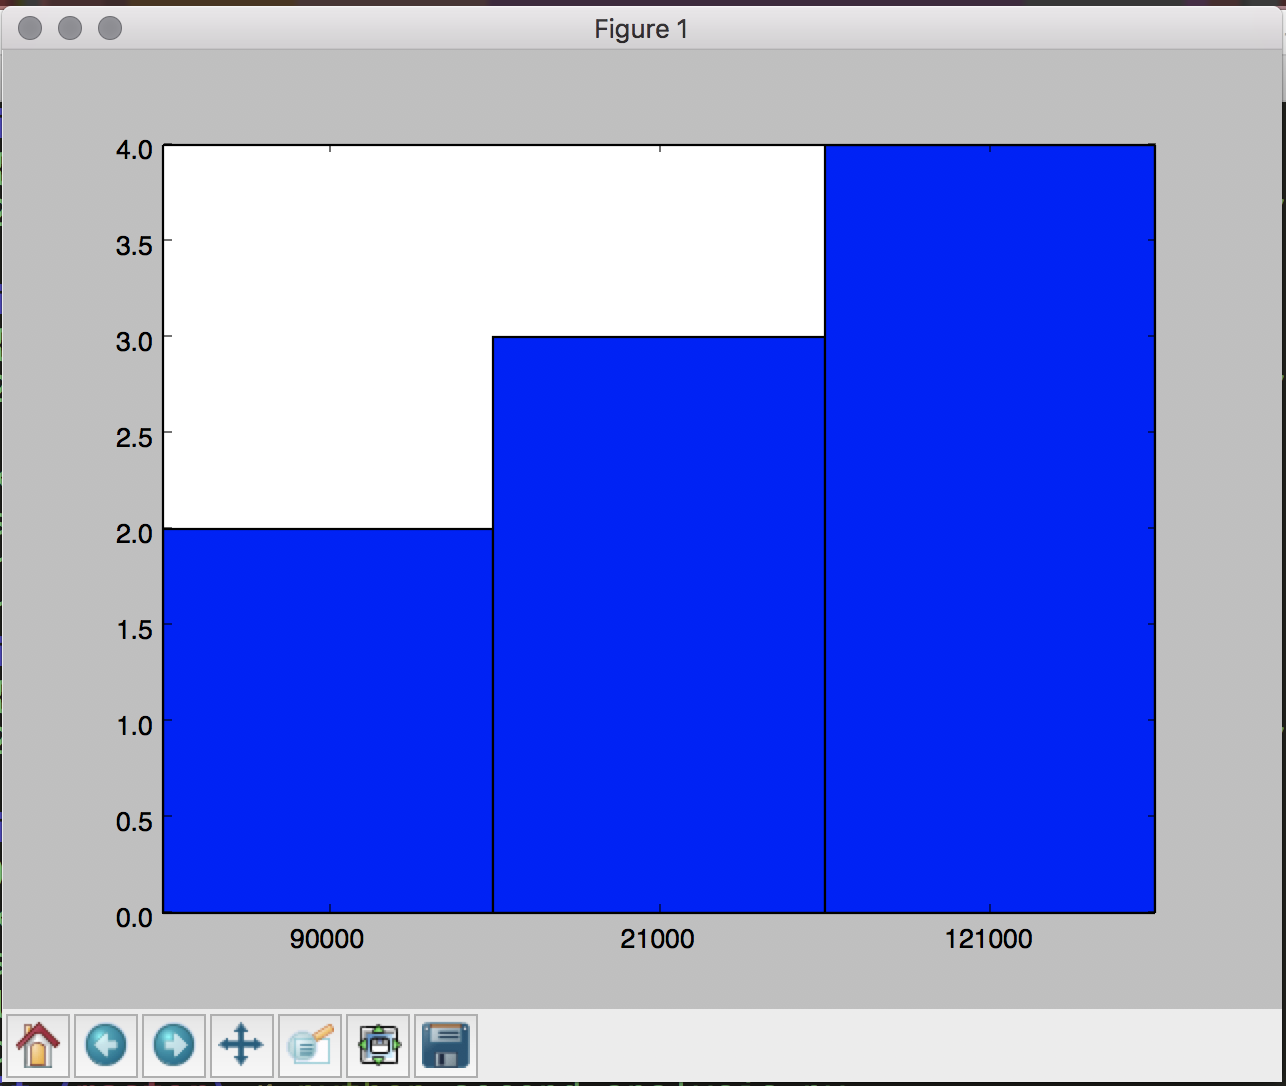
The idea is exploratory data analysis, the output rendered as a histogram to get an idea of relative frequency of records:
The example data set looks like this:
{"blockNumber":"1941895","blockHash":"0x53464299a83cecc3e4d930b617c9518b8f74139265423d8110a919f5180bec79","hash":"0x0abe75e40a954d4d355e25e4498f3580e7d029769897d4187c323080a0be0fdd","from":"0x4586ffaf28e08b1613dd96ced9b57d52e8ad9d72","to":"0x91337a300e0361bddb2e377dd4e88ccb7796663d","gas":"21000","gasUsed":"21000","gasPrice":"20000000000","input":"","logs":[],"nonce":"1","value":"0x22c06103f88111000","timestamp":"2016-07-24 20:47:25 UTC"}
{"blockNumber":"1941645","blockHash":"0x78804d09bb4e7126f53133e33e3548e0f04a691c01661ab9b719c3811e54355e","hash":"0x22c2b6490900b21d67ca56066e127fa57c0af973b5d166ca1a4bf52fcb6cf81c","from":"0x81bbf9f19ffe8368efe7611ccf5dcbdb4618b645","to":"0xb01a7866a244dbb600a7bbd170d43d4221838868","gas":"90000","gasUsed":"21000","gasPrice":"20000000000","input":"","logs":[],"nonce":"0","value":"0x4563918244f40000","timestamp":"2016-07-24 19:57:50 UTC"}
{"blockNumber":"1941910","blockHash":"0xc7ba89fc0110a033c4bd03be4505014761141b956c228bc51ec49c15a4508ce4","hash":"0x8570106b0385caf729a17593326db1afe0d75e3f8c6daef25cd4a0499a873a6f","from":"0x91337a300e0361bddb2e377dd4e88ccb7796663d","to":"0x9fde2180b544b7690c35bdc66182eb843ac38030","gas":"90000","gasUsed":"21000","gasPrice":"20000000000","input":"","logs":[],"nonce":"6356","value":"0x41e92b66341ef0000","timestamp":"2016-07-24 20:50:12 UTC"}
{"blockNumber":"1941919","blockHash":"0x4785c1b1a678cf7058e1fed3fc1c7d33c4326c2fb309f5fc75688f23d496b61c","hash":"0x8adfe7fc3cf0eb34bb56c59fa3dc4fdd3ec3f3514c0100fef800f065219b7707","from":"0x69ca903e87329fd63a3c7b2d3efde6a9bf3c3d45","to":"0xbfc39b6f805a9e40e77291aff27aee3c96915bdd","gas":"40000","gasUsed":"29130","gasPrice":"30000000000","input":"","logs":[{"address":"0xbfc39b6f805a9e40e77291aff27aee3c96915bdd","topics":["0x23919512b2162ddc59b67a65e3b03c419d4105366f7d4a632f5d3c3bee9b1cff"],"data":"AAAAAAAAAAAAAAAAwNMyg48U70L83hzyUYxCfdtnZyk="}],"nonce":"20","value":"0x1d2eb2accbaf90800","timestamp":"2016-07-24 20:52:08 UTC"}
{"blockNumber":"1941922","blockHash":"0xd46dbf526f6d7c9197e841c8a4d7b2f4abdac4a62860cffabb943a46d07a86d4","hash":"0x8b0fe2b7727664a14406e7377732caed94315b026b37577e2d9d258253067553","from":"0x0b2c5cba2dc240e867f7721412c20e6016596d26","to":"0x9c83fe12c7575ea7350019e04253d3620957851f","gas":"21000","gasUsed":"21000","gasPrice":"21000000000","input":"","logs":[],"nonce":"2","value":"0x7ce66c50e2840000","timestamp":"2016-07-24 20:52:51 UTC"}
{"blockNumber":"1941688","blockHash":"0x86bb1e90d0fa7be11d3f196057976383bb73cbd1596992e868155a576b5ddfb9","hash":"0x244b29b60c696f4ab07c36342344fe6116890f8056b4abc9f734f7a197c93341","from":"0x006cdc135b4e3a89d3ac1027ec3de609b8fff500","to":"0x58ae42a38d6b33a1e31492b60465fa80da595755","gas":"50000","gasUsed":"50000","gasPrice":"20000000000","input":"","logs":[],"nonce":"47","value":"0xc7140013deaf40","error":"invalid jump destination (PUSH1) 2","timestamp":"2016-07-24 20:06:38 UTC"}
{"blockNumber":"1941794","blockHash":"0x41ee74e34cbf9ef4116febea958dbc260e2da3a6bf6f601bfaeb2cd9ab944a29","hash":"0xf2b5b8fb173e371cbb427625b0339f6023f8b4ec3701b7a5c691fa9cef9daf63","from":"0x3c0cbb196e3847d40cb4d77d7dd3b386222998d9","to":"0x2ba24c66cbff0bda0e3053ea07325479b3ed1393","gas":"121000","gasUsed":"21000","gasPrice":"20000000000","input":"","logs":[],"nonce":"14","value":"0x24406420d09ce7440000","timestamp":"2016-07-24 20:28:11 UTC"}
{"blockNumber":"1941716","blockHash":"0x75e1602cad967a781f4a2ea9e19c97405fe1acaa8b9ad333fb7288d98f7b49e3","hash":"0xf8f2a397b0f7bb1ff212b6bcc57e4a56ce3e27eb9f5839fef3e193c0252fab26","from":"0xa0480c6f402b036e33e46f993d9c7b93913e7461","to":"0xb2ea1f1f997365d1036dd6f00c51b361e9a3f351","gas":"121000","gasUsed":"21000","gasPrice":"20000000000","input":"","logs":[],"nonce":"1","value":"0xde0b6b3a7640000","timestamp":"2016-07-24 20:12:17 UTC"}
{"blockNumber":"1941794","blockHash":"0x41ee74e34cbf9ef4116febea958dbc260e2da3a6bf6f601bfaeb2cd9ab944a29","hash":"0xf275b8fb173e371cbb427625b0339f6023f8b4ec3701b7a5c691fa9cef9daf63","from":"0x3c0cbb196e3847d40cb4d77d7dd3b386222998d9","to":"0x2ba24c66cbff0bda0e3053ea07325479b3ed1393","gas":"121000","gasUsed":"21000","gasPrice":"20000000000","input":"","logs":[],"nonce":"14","value":"0x24406420d09ce7440000","timestamp":"2016-07-24 20:28:11 UTC"}
{"blockNumber":"1941794","blockHash":"0x41ee74e34cbf9ef4116febea958dbc260e2da3a6bf6f601bfaeb2cd9ab944a29","hash":"0xf285b8fb173e371cbb427625b0339f6023f8b4ec3701b7a5c691fa9cef9daf63","from":"0x3c0cbb196e3847d40cb4d77d7dd3b386222998d9","to":"0x2ba24c66cbff0bda0e3053ea07325479b3ed1393","gas":"121000","gasUsed":"21000","gasPrice":"20000000000","input":"","logs":[],"nonce":"14","value":"0x24406420d09ce7440000","timestamp":"2016-07-24 20:28:11 UTC"}
{"blockNumber":"1941895","blockHash":"0x53464299a83cecc3e4d930b617c9518b8f74139265423d8110a919f5180bec79","hash":"0x0abg75e40a954d4d355e25e4498f3580e7d029769897d4187c323080a0be0fdd","from":"0x4586ffaf28e08b1613dd96ced9b57d52e8ad9d72","to":"0x91337a300e0361bddb2e377dd4e88ccb7796663d","gas":"21000","gasUsed":"21000","gasPrice":"20000000000","input":"","logs":[],"nonce":"1","value":"0x22c06103f88111000","timestamp":"2016-07-24 20:47:25 UTC"}
The code is here:
#data processing
import re
import pprint
#sorting
import operator
from collections import Counter
#visualization rendering
import matplotlib.pyplot as plt
import numpy as np
from operator import itemgetter
# read in the data
data = open('toy.json', 'r')
new_dict = {}
for line in data:
 identifier = re.search('(\"hash\"\:\s?\"(\w+)\")', line)
 if identifier:
 found_identifier = identifier.group(2)
 # print(found)
 gas = re.search('(\"gas\"\:\s?\"(\w+)\")', line)
 if gas:
 found_gas = gas.group(2)
 # print(found)
 new_dict.update({found_identifier:found_gas})
# make it into tuple
sorted_x = sorted(new_dict.items(), key=operator.itemgetter(1))
# prepare for counter
# flat_list = [x[1] for x in sorted_x if int(x[1]) > 1]
flat_list = [x[1] for x in sorted_x]
# count 'em up
flat_list = Counter(flat_list)
# prune threshold
to_remove = set()
for key, value in flat_list.viewitems():
 if value < 2:
 to_remove.add(key)
for key in to_remove:
 del flat_list[key]
pprint.pprint(flat_list)
# visualization
c = Counter(flat_list).items()
c.sort(key=itemgetter(1))
labels, values = zip(*c)
indexes = np.arange(len(labels))
width = 1
plt.bar(indexes, values, width)
plt.xticks(indexes + width * 0.5, labels)
plt.show()
1 Answer 1
Python has a built-in json module, so you should use that instead of parsing the lines by yourself, no need for regex here.
You can just iterate over the lines of the file (which seem to contain a valid JSON object each), and build a list from that:
import json
from collections import Counter
import matplotlib.pyplot as plt
import numpy as np
def at_least(c, threshold):
 """Return a Counter of values which are at_least (>=) threshold"""
 return Counter(el for el in c.elements() if c[el] >= threshold)
def draw_hist(labels, values):
 indices = np.arange(len(labels))
 width = 1
 plt.bar(indices, values, width)
 plt.xticks(indices + width * 0.5, labels)
 plt.show()
if __name__ == "__main__":
 with open("toy.json") as f:
 data = [json.loads(line) for line in f]
 gas = {line["hash"]: int(line["gas"]) for line in data}
 gas_hist_values = at_least(Counter(gas.values()), 2)
 labels, values = zip(*reversed(gas_hist_values.most_common()))
 draw_hist(labels, values)
Note that if a hash appears twice, this code, just like your original code, overwrites it with the value that appears last.
I took out a lot of unnecessary sorting and calls of Counter. Instead I used the method Counter.most_common, which works like dict.items, except that it returns the items in order of decreasing counts. Then you just need to reverse them to get them in increasing order.
I also made your code more re-usable by encapsulating some of the functionality in functions and guarding the actual code with a if __name__ == "__main__" guard.
I also gave your variables clearer names.
Alternatively, since you are already using numpy and matplotlib, it might be worth it to take a look at pandas. It has a read_json method, which needs only a little preparation (you need to read the whole file at once in a string, though...):
import pandas as pd
import numpy as np
import matplotlib.pyplot as plt
with open("toy.json") as f:
 df = pd.read_json("[" + ",".join(f) + "]", orient='records')
values, labels = np.histogram(df["gas"])
above_threshold = np.where(values >= 2)
plt.bar(labels[above_threshold], values[above_threshold], 1000)
While this is way easier, the x-axis is now the actual numerical values, instead of different labels. But for this you could use your plotting again as well. Note that they are not sorted either, but it is usually easier to understand if numerical are in increasing order, instead of in order of increasing counts...
-
1\$\begingroup\$ Why not
json.loadsline by line instead of the whole file at once? \$\endgroup\$301_Moved_Permanently– 301_Moved_Permanently2017年09月15日 09:34:47 +00:00Commented Sep 15, 2017 at 9:34 -
\$\begingroup\$ @MathiasEttinger This is indeed easier to understand, will fix the description as well... \$\endgroup\$Graipher– Graipher2017年09月15日 09:38:51 +00:00Commented Sep 15, 2017 at 9:38
Explore related questions
See similar questions with these tags.
[]around the whole thing and add,after each dictionary. \$\endgroup\$