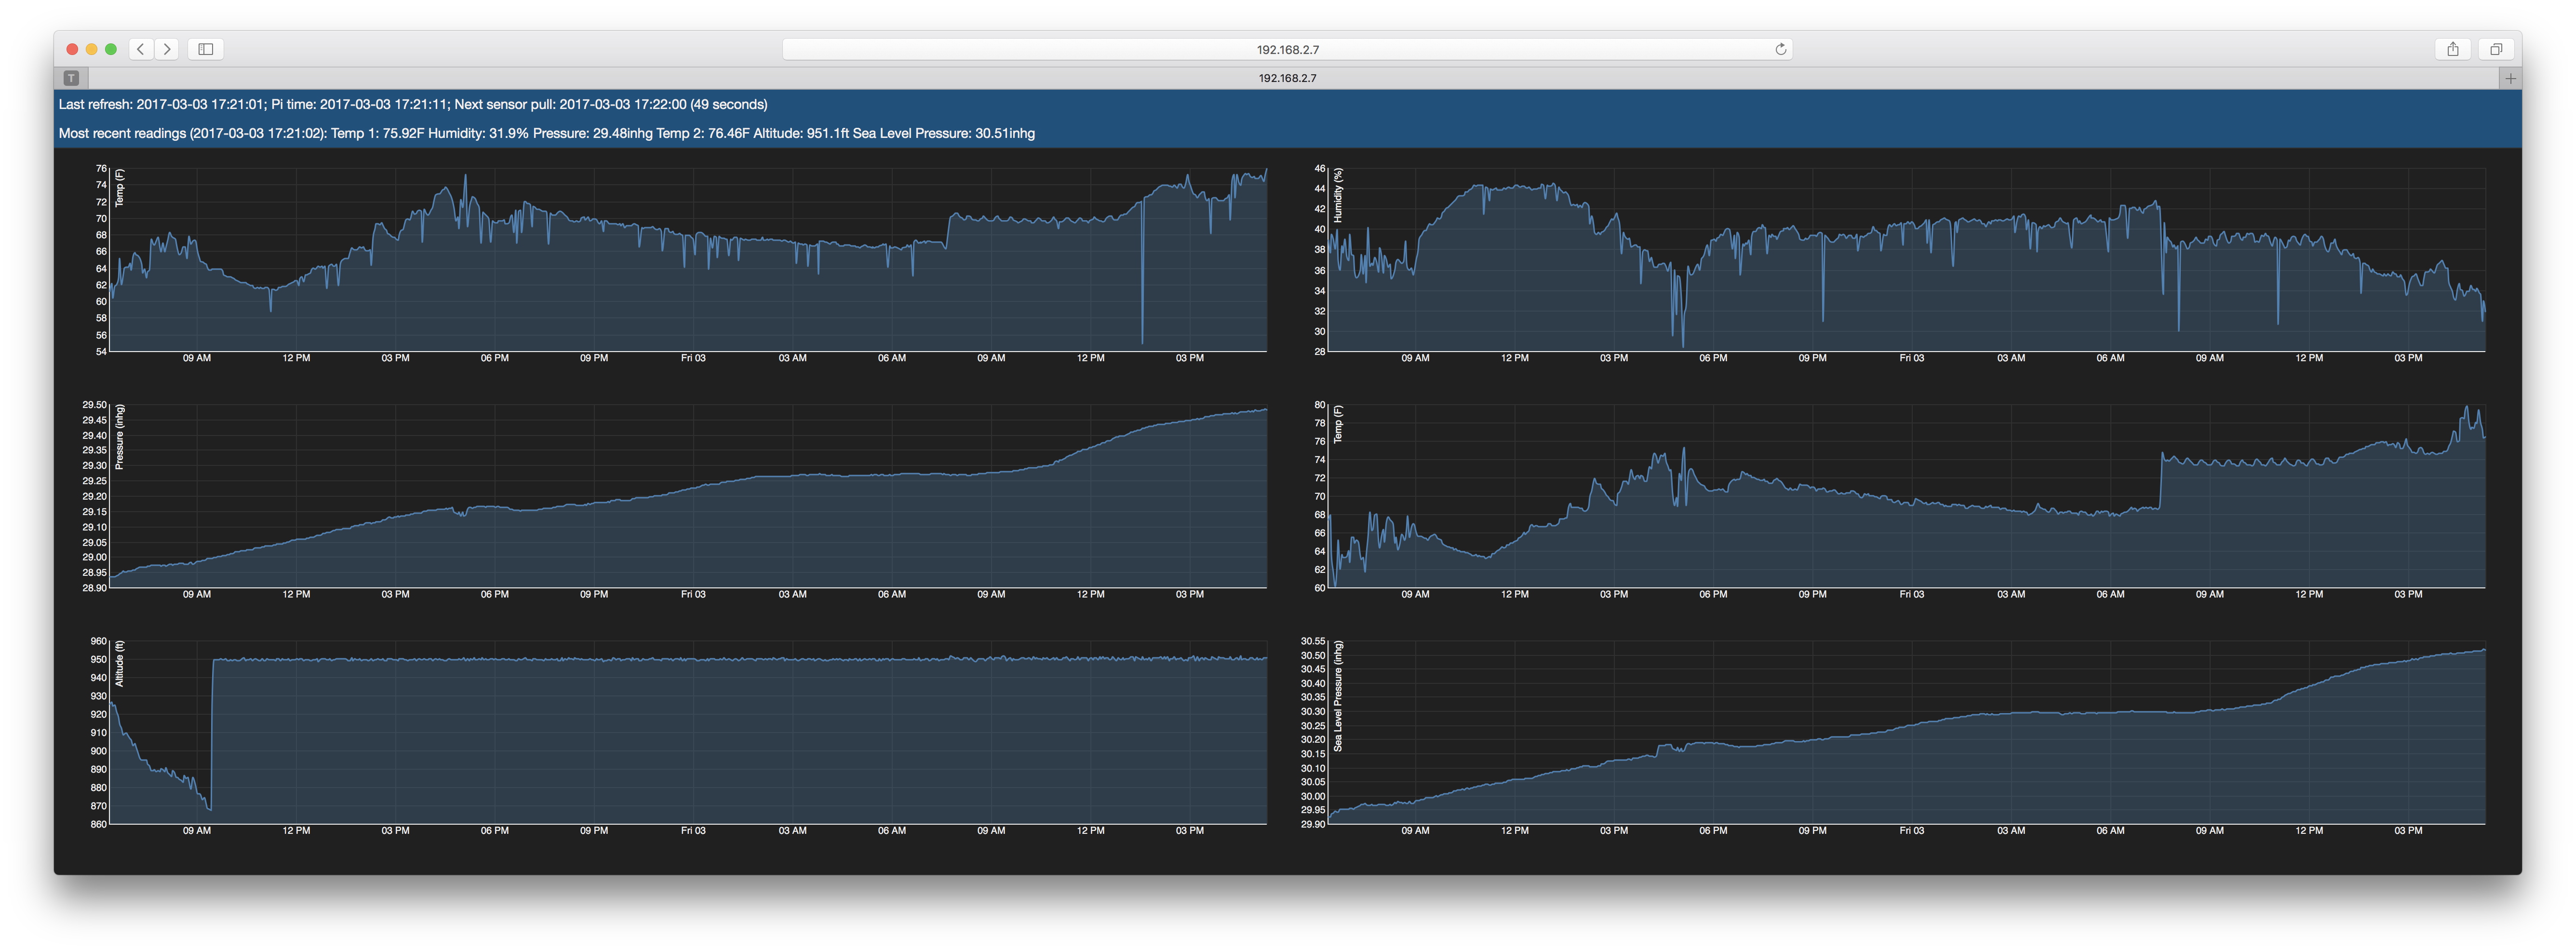
Last time I worked on a DHT11 sensor and got a lot of feedback, this time I have added another sensor (the BMP180), stored both of them in MySQL, and am now displaying them to the web.
The Raspberry Pi now has an HTTP server running on port 80, and I've built a small little UI to display all my sensor data.
So this is all provided by a few files, one of them is a JavaScript file, one is a CSS file, one is an HTML file, and the rest are python files.
We'll start with the JavaScript for the graphs. This is pretty simple and self explanatory, the biggest issue I have is I need to break this down further so that there's no duplication. This is graphs.js:
function buildGraph(svgTitle, table, title) {
 var svg = d3.select(svgTitle);
 var margin = {top: 20, right: 20, bottom: 30, left: 40};
 var width = +svg.attr("width") - margin.left - margin.right;
 var height = +svg.attr("height") - margin.top - margin.bottom;
 var g = svg.append("g").attr("transform", "translate(" + margin.left + "," + margin.top + ")");
 var parseTime = d3.timeParse("%Y-%m-%d %H:%M:%S");
 var x = d3.scaleTime().rangeRound([0, width]);
 var y = d3.scaleLinear().rangeRound([height, 0]);
 var line = d3.line()
 .curve(d3.curveMonotoneX)
 //.curve(d3.curveBasis)
 .x(function(d) { return x(d.Logged); })
 .y(function(d) { return y(d.Value); });
 var area = d3.area()
 .curve(d3.curveMonotoneX)
 //.curve(d3.curveBasis)
 .x(function(d) { return x(d.Logged); })
 .y1(function(d) { return y(d.Value); });
 d3.tsv("history.py?LogType=" + table, function(d) {
 d.Logged = parseTime(d.Logged);
 d.Value = +d.Value;
 return d;
 }, function(error, data) {
 if (error) throw error;
 x.domain(d3.extent(data, function(d) { return d.Logged; }));
 var yS = y.domain(d3.extent(data, function(d) { return d.Value; })).nice();
 area.y0(y(yS.domain()[0]));
 g.append("g")
 .attr("class", "x axis")
 .attr("transform", "translate(0," + height + ")")
 .call(d3.axisBottom(x).tickSize(-height));
 g.append("g")
 .attr("class", "y axis")
 .call(d3.axisLeft(y).tickSize(-width))
 .append("text")
 .attr("fill", "#000")
 .attr("transform", "rotate(-90)")
 .attr("y", 6)
 .attr("dy", "0.71em")
 .attr("text-anchor", "em")
 .text(title);
 g.select(".y")
 .select(".domain")
 .attr("transform", "translate(-1,0)");
 g.append("path")
 .datum(data)
 .attr("fill", "none")
 .attr("stroke", "steelblue")
 .attr("stroke-linejoin", "round")
 .attr("stroke-linecap", "round")
 .attr("stroke-width", 1.5)
 .attr("d", line);
 g.append("path")
 .datum(data)
 .attr("fill", "steelblue")
 .attr("fill-opacity", "0.3")
 .attr("stroke", "none")
 .attr("d", area);
 });
}
function updateGraph(svgTitle, table, title) {
 var svg = d3.select(svgTitle);
 var margin = {top: 20, right: 20, bottom: 30, left: 40};
 var width = +svg.attr("width") - margin.left - margin.right;
 var height = +svg.attr("height") - margin.top - margin.bottom;
 var g = svg.select("g");
 var parseTime = d3.timeParse("%Y-%m-%d %H:%M:%S");
 var x = d3.scaleTime().rangeRound([0, width]);
 var y = d3.scaleLinear().rangeRound([height, 0]);
 var line = d3.line()
 .curve(d3.curveMonotoneX)
 //.curve(d3.curveBasis)
 .x(function(d) { return x(d.Logged); })
 .y(function(d) { return y(d.Value); });
 var area = d3.area()
 .curve(d3.curveMonotoneX)
 //.curve(d3.curveBasis)
 .x(function(d) { return x(d.Logged); })
 .y1(function(d) { return y(d.Value); });
 d3.tsv("history.py?LogType=" + table, function(d) {
 d.Logged = parseTime(d.Logged);
 d.Value = +d.Value;
 return d;
 }, function(error, data) {
 if (error) throw error;
 x.domain(d3.extent(data, function(d) { return d.Logged; }));
 var yS = y.domain(d3.extent(data, function(d) { return d.Value; })).nice();
 area.y0(y(yS.domain()[0]));
 g.selectAll("path").remove();
 g.selectAll("g").remove();
 g.append("g")
 .attr("class", "x axis")
 .attr("transform", "translate(0," + height + ")")
 .call(d3.axisBottom(x).tickSize(-height));
 g.append("g")
 .attr("class", "y axis")
 .call(d3.axisLeft(y).tickSize(-width))
 .append("text")
 .attr("fill", "#000")
 .attr("transform", "rotate(-90)")
 .attr("y", 6)
 .attr("dy", "0.71em")
 .attr("text-anchor", "em")
 .text(title);
 g.select(".y")
 .select(".domain")
 .attr("transform", "translate(-1,0)");
 g.append("path")
 .datum(data)
 .attr("fill", "none")
 .attr("stroke", "steelblue")
 .attr("stroke-linejoin", "round")
 .attr("stroke-linecap", "round")
 .attr("stroke-width", 1.5)
 .attr("d", line);
 g.append("path")
 .datum(data)
 .attr("fill", "steelblue")
 .attr("fill-opacity", "0.3")
 .attr("stroke", "none")
 .attr("d", area);
 });
}
Next we have the index.html page, which is not actually loaded by the browser. It's the template for the index.py to load, though it doesn't have to be now. (Previously I was doing wonky things with it.)
<!DOCTYPE html PUBLIC "-//W3C//DTD XHTML 1.0 Transitional//EN" "http://www.w3.org/TR/xhtml1/DTD/xhtml1-transitional.dtd">
<html xmlns="http://www.w3.org/1999/xhtml">
<head>
 <link href='bootstrap/css/bootstrap.min.css' rel='stylesheet'>
 <link href="style.css" rel="stylesheet" />
 <script src='d3/d3.min.js'></script>
 <script src='graphs.js'></script>
</head>
<body>
 <div class="header">
 Last refresh: <span class="lastRefresh"></span>;
 Pi time: <span class="piTime"></span>;
 Next sensor pull: <span class="nextRefresh"></span> (<span class="nextRefreshSeconds"></span>)
 </div>
 <div class="current">
 Most recent readings (<span id="logValue"></span>):
 <span class="">
 Temp 1:
 <span id="temperatureValue"></span>F
 </span>
 <span class="">
 Humidity:
 <span id="humidityValue"></span>%
 </span>
 <span class="">
 Pressure:
 <span id="pressureValue"></span>inhg
 </span>
 <span class="">
 Temp 2:
 <span id="bmpTempValue"></span>F
 </span>
 <span class="">
 Altitude:
 <span id="altitudeValue"></span>ft
 </span>
 <span class="">
 Sea Level Pressure:
 <span id="seaPressureValue"></span>inhg
 </span>
 </div>
 <div class='graphBlock'>
 <svg class='temp' width='1260' height='240'></svg>
 <svg class='humid' width='1260' height='240'></svg>
 <svg class='pressure' width='1260' height='240'></svg>
 <svg class='bmpTemp' width='1260' height='240'></svg>
 <svg class='altitude' width='1260' height='240'></svg>
 <svg class='seaPressure' width='1260' height='240'></svg>
 </div>
 <script src='jquery.1.12.4.min.js'></script>
 <script src='bootstrap/js/bootstrap.min.js'></script>
 <script>
 Number.prototype.padLeft = function(base, chr) {
 var len = (String(base || 10).length - String(this).length) + 1;
 return len > 0 ? new Array(len).join(chr || '0') + this : this;
 }
 function round(value, decimals) {
 return Number(Math.round(value + 'e' + decimals) + 'e-' + decimals);
 }
 function updateGraphs(callback) {
 if (callback == null) {
 callback = updateGraph;
 }
 callback('.temp', 'Temperature', 'Temp (F)');
 callback('.humid', 'Humidity', 'Humidity (%)');
 callback('.pressure', 'Pressure', 'Pressure (inhg)');
 callback('.bmpTemp', 'BmpTemp', 'Temp (F)');
 callback('.altitude', 'Altitude', 'Altitude (ft)');
 callback('.seaPressure', 'SeaPressure', 'Sea Level Pressure (inhg)');
 var d = new Date;
 var dFormat = [d.getUTCFullYear(), (d.getUTCMonth() + 1).padLeft(), d.getUTCDate().padLeft()].join('-');
 dFormat += " ";
 dFormat += [d.getUTCHours().padLeft(), d.getUTCMinutes().padLeft(), d.getUTCSeconds().padLeft()].join(':');
 $('.lastRefresh').html(dFormat);
 }
 function updateTimes() {
 updatePiTime();
 }
 function updatePiTime(target, params) {
 var xmlHttp = new XMLHttpRequest();
 xmlHttp.onreadystatechange = function() {
 if (xmlHttp.readyState == 4 && xmlHttp.status == 200) {
 var text = xmlHttp.responseText.trim().split("\n");
 $(".nextRefresh").html(text[0]);
 $(".nextRefreshSeconds").html(text[1]);
 $(".piTime").html(text[2]);
 }
 }
 xmlHttp.open("GET", "time.py?All=true", true);
 xmlHttp.send(null);
 }
 function updateCurrents() {
 var xmlHttp = new XMLHttpRequest();
 xmlHttp.onreadystatechange = function() {
 if (xmlHttp.readyState == 4 && xmlHttp.status == 200) {
 var text = xmlHttp.responseText.trim().split("\n");
 text.forEach(function(line) {
 var items = line.split("\t");
 switch (items[0]) {
 case "Humidity":
 $("#humidityValue").html(round(items[2], 2));
 break;
 case "BmpTemp":
 $("#bmpTempValue").html(round(items[2], 2));
 break;
 case "Pressure":
 $("#pressureValue").html(round(items[2], 2));
 break;
 case "Altitude":
 $("#altitudeValue").html(round(items[2], 2));
 break;
 case "Temperature":
 $("#temperatureValue").html(round(items[2], 2));
 break;
 case "SeaPressure":
 $("#seaPressureValue").html(round(items[2], 2));
 break;
 }
 $("#logValue").html(items[1]);
 });
 }
 }
 xmlHttp.open("GET", "latest.py", true);
 xmlHttp.send(null);
 }
 updateGraphs(buildGraph);
 updateTimes();
 updateCurrents();
 setInterval(updateGraphs, 5000);
 setInterval(updateTimes, 500);
 setInterval(updateCurrents, 1000);
 </script>
</body>
</html>
As you can see, the root of the web page is JavaScript, that's to keep data updated so that page refreshes aren't required.
All the CSS code, which is pretty simple (style.css):
body {
 background: #202020;
 color: #efefef;
}
svg {
 display: inline-block;
}
.graphBlock {
 width: 100%;
 text-align: center;
}
.axis line {
 stroke: #303030;
}
.axis.y path,
.axis.y .tick:nth-child(2) line {
 stroke: #efefef;
}
.axis path {
 stroke: #303030;
}
.axis text {
 fill: #efefef;
}
.header {
 /*color: #efefef;*/
 background: #07507F;
 padding: 5px;
}
.current {
 /*color: #efefef;*/
 background: #07507F;
 padding: 5px;
 border-bottom: 1px solid #303030;
}
Then we have index.py, the main landing page:
#!/usr/bin/python
from datetime import datetime
import pymysql
# Now we do the rest of the work
if __name__ == "__main__":
 # Print the header first, always
 print "Content-type: text/html"
 print
 with open("index.html") as template:
 print template.read()
Then we have the asynchronously requested python scripts. The first is time.py since it's the shortest:
#!/usr/bin/python
from datetime import datetime, timedelta
import cgi
DEFAULT_DATE_FORMAT = "%Y-%m-%d %H:%M:%S"
if __name__ == '__main__':
 print "Content-Type: text/html"
 print
 args = cgi.FieldStorage()
 date_format = DEFAULT_DATE_FORMAT
 if "DateFormat" in args:
 date_format = args["DateFormat"].value
 if "Next" in args or "All" in args:
 utctime = datetime.utcnow()
 print (utctime + timedelta(seconds = 60 - utctime.second)).strftime(date_format)
 if "NextIn" in args or "All" in args:
 utctime = datetime.utcnow()
 print str(60 - utctime.second) + " seconds"
 if (not "Next" in args and not "NextIn" in args) or "All" in args:
 print datetime.utcnow().strftime(date_format)
You can probably guess that it's only job is to return each time operation.
Next we have latest.py, which returns the latest value of each metric:
#!/usr/bin/python
from datetime import datetime, timedelta
import cgi
import pymysql
DATE_FORMAT = "%Y-%m-%d %H:%M:%S"
DEFAULT_DAY_LIMIT = 7
DEFAULT_MINUTE_GROUPING = 1
if __name__ == '__main__':
 print "Content-type: text/html"
 print
 args = cgi.FieldStorage()
 start_date = (datetime.utcnow() - timedelta(days = DEFAULT_DAY_LIMIT)).strftime(DATE_FORMAT)
 end_date = datetime.utcnow().strftime(DATE_FORMAT)
 minute_group = DEFAULT_MINUTE_GROUPING
 gather = []
 gather.append(("HumidityLog", lambda x: x))
 gather.append(("BmpTempLog", lambda c: c * 1.8 + 32))
 gather.append(("PressureLog", lambda p: p * 0.0002953))
 gather.append(("AltitudeLog", lambda m: m * 3.28084))
 gather.append(("TemperatureLog", lambda c: c * 1.8 + 32))
 gather.append(("SeaPressureLog", lambda p: p * 0.0002953))
 if "Start" in args:
 start_date = args["Start"].value
 if "End" in args:
 end_date = args["End"].value
 conn = pymysql.connect(
 db='WeatherLog',
 user='WeatherLog',
 passwd='Weather!',
 host='localhost')
 cursor = conn.cursor()
 for table, formatter in gather:
 cursor.execute("""
 SELECT
 Logged, AVG(Value)
 FROM
 {0}
 WHERE
 Logged >= '{1}' AND Logged <= '{2}'
 GROUP BY
 ROUND(UNIX_TIMESTAMP(Logged)/({3} * 60))
 ORDER BY
 Logged DESC
 LIMIT
 1;""".format(table, start_date, end_date, minute_group))
 for row in cursor.fetchall():
 print "{2}\t{0}\t{1}".format(row[0], formatter(row[1]), table[:-3])
And then finally we have history.py, which returns the history for a single metric in tab-delimited format:
#!/usr/bin/python
from datetime import datetime, timedelta
import cgi
import pymysql
DATE_FORMAT = "%Y-%m-%d %H:%M:%S"
DEFAULT_DAY_LIMIT = 7
DEFAULT_MINUTE_GROUPING = 3
if __name__ == '__main__':
 print "Content-type: text/html"
 print
 args = cgi.FieldStorage()
 start_date = (datetime.utcnow() - timedelta(days = DEFAULT_DAY_LIMIT)).strftime(DATE_FORMAT)
 end_date = datetime.utcnow().strftime(DATE_FORMAT)
 minute_group = DEFAULT_MINUTE_GROUPING
 table = "TemperatureLog"
 formatter = lambda c: c * 1.8 + 32
 if "LogType" in args:
 log_type = args["LogType"].value
 if log_type == "Humidity":
 table = "HumidityLog"
 formatter = lambda x: x
 elif log_type == "BmpTemp":
 table = "BmpTempLog"
 formatter = lambda c: c * 1.8 + 32
 elif log_type == "Pressure":
 table = "PressureLog"
 formatter = lambda p: p * 0.0002953
 elif log_type == "Altitude":
 table = "AltitudeLog"
 formatter = lambda m: m * 3.28084
 elif log_type == "SeaPressure":
 table = "SeaPressureLog"
 formatter = lambda p: p * 0.0002953
 if "Start" in args:
 start_date = args["Start"].value
 if "End" in args:
 end_date = args["End"].value
 conn = pymysql.connect(
 db='WeatherLog',
 user='WeatherLog',
 passwd='Weather!',
 host='localhost')
 cursor = conn.cursor()
 cursor.execute("""
 SELECT
 Logged, AVG(Value)
 FROM
 {0}
 WHERE
 Logged >= '{1}' AND Logged <= '{2}'
 GROUP BY
 ROUND(UNIX_TIMESTAMP(Logged)/({3} * 60));""".format(table, start_date, end_date, minute_group))
 didfirst = 0
 print "Logged\tValue"
 for row in cursor.fetchall():
 didfirst = 1
 print "{0}\t{1}".format(row[0], formatter(row[1]))
Any suggestions, advice and critiques are welcome. This is going to slowly get larger, and I'm going to be significantly increasing what it does so I want to get the structure and design setup correctly initially.
-
\$\begingroup\$ Those temperature readings look glitchy. \$\endgroup\$200_success– 200_success2017年03月03日 18:01:13 +00:00Commented Mar 3, 2017 at 18:01
-
\$\begingroup\$ @200_success I have a loose ground on the sensor, I haven't yet soldered anything together, so sometimes the ground breaks and the reading is messed up. \$\endgroup\$Der Kommissar– Der Kommissar2017年03月03日 18:01:49 +00:00Commented Mar 3, 2017 at 18:01
-
\$\begingroup\$ @EBrown there is also the "Home Assistant" project - looks relevant to the things you are working on. \$\endgroup\$alecxe– alecxe2017年03月03日 18:03:28 +00:00Commented Mar 3, 2017 at 18:03
1 Answer 1
You’ve got at least two bits of somehow duplicated code in your Python files. Better build a utility module to reduce that.
utils.py
import pymysql
METRICS_FORMATTERS = {
 "HumidityLog": lambda x: x,
 "BmpTempLog": lambda c: c * 1.8 + 32,
 "PressureLog": lambda p: p * 0.0002953,
 "AltitudeLog": lambda m: m * 3.28084,
 "TemperatureLog": lambda c: c * 1.8 + 32,
 "SeaPressureLog": lambda p: p * 0.0002953,
}
def connect_to_database():
 return pymysql.connect(
 db='WeatherLog',
 user='WeatherLog',
 passwd='Weather!',
 host='localhost')
You can then simplify your scripts:
latest.py
#!/usr/bin/python
from datetime import datetime, timedelta
import cgi
import utils
DATE_FORMAT = "%Y-%m-%d %H:%M:%S"
DEFAULT_DAY_LIMIT = 7
DEFAULT_MINUTE_GROUPING = 1
if __name__ == '__main__':
 print "Content-type: text/html"
 print
 args = cgi.FieldStorage()
 start_date = (datetime.utcnow() - timedelta(days=DEFAULT_DAY_LIMIT)).strftime(DATE_FORMAT)
 end_date = datetime.utcnow().strftime(DATE_FORMAT)
 minute_group = DEFAULT_MINUTE_GROUPING
 if "Start" in args:
 start_date = args["Start"].value
 if "End" in args:
 end_date = args["End"].value
 conn = utils.connect_to_database()
 cursor = conn.cursor()
 for table, formatter in utils.METRICS_FORMATTERS.iteritems():
 cursor.execute("""
 SELECT
 Logged, AVG(Value)
 FROM
 {0}
 WHERE
 Logged >= '{1}' AND Logged <= '{2}'
 GROUP BY
 ROUND(UNIX_TIMESTAMP(Logged)/({3} * 60))
 ORDER BY
 Logged DESC
 LIMIT
 1;""".format(table, start_date, end_date, minute_group))
 for row in cursor.fetchall():
 print "{2}\t{0}\t{1}".format(row[0], formatter(row[1]), table[:-3])
history.py
#!/usr/bin/python
from datetime import datetime, timedelta
import cgi
import utils
DATE_FORMAT = "%Y-%m-%d %H:%M:%S"
DEFAULT_DAY_LIMIT = 7
DEFAULT_MINUTE_GROUPING = 3
if __name__ == '__main__':
 print "Content-type: text/html"
 print
 args = cgi.FieldStorage()
 start_date = (datetime.utcnow() - timedelta(days = DEFAULT_DAY_LIMIT)).strftime(DATE_FORMAT)
 end_date = datetime.utcnow().strftime(DATE_FORMAT)
 minute_group = DEFAULT_MINUTE_GROUPING
 table = "TemperatureLog"
 formatter = lambda c: c * 1.8 + 32
 if "LogType" in args:
 log_type = args["LogType"].value + "Log"
 try:
 formatter = utils.METRICS_FORMATTERS[log_type]
 except KeyError:
 pass
 else:
 table = log_type
 if "Start" in args:
 start_date = args["Start"].value
 if "End" in args:
 end_date = args["End"].value
 conn = connect_to_database()
 cursor = conn.cursor()
 cursor.execute("""
 SELECT
 Logged, AVG(Value)
 FROM
 {0}
 WHERE
 Logged >= '{1}' AND Logged <= '{2}'
 GROUP BY
 ROUND(UNIX_TIMESTAMP(Logged)/({3} * 60));""".format(table, start_date, end_date, minute_group))
 didfirst = 0
 print "Logged\tValue"
 for row in cursor.fetchall():
 didfirst = 1
 print "{0}\t{1}".format(row[0], formatter(row[1]))
Writting that, I realize that there are even more duplicated code, let's refactor the hell out of it. You need:
- A way to retrieve start and end dates out of the query string or sensible defaults;
- A way to perform a
SELECTstatement; - A way to format the response (with headers first, always).
Start and end arguments are simple and are done similarly to connect_to_database(). Performing the query, though, can benefit from some advices. For starter, and even though the raspberry is on your network with only you accessing it, it always feel bad to see SQL queries with user-provided values injected directly into it. You should take the habit to use parametrized statements; pymysql using the 'format' kind of markers, you can use:
cursor.execute("""
 SELECT Logged, Avg(Value)
 FROM %s
 WHERE Logged >= '%s' AND Logged <= '%s'
 GROUP BY ROUND(UNIX_TIMESTAMP(Logged)/(%s * 60));
""", (table, start_date, end_date, minute_group))
You may optionnaly also use the connection's context-manager that provides you with a cursor open a transaction and auto commit/rollback it when leaving the block (even though it's not useful on a SELECT statement, it's also a good habit to have).
Also don't forget to close() your connection once you’re done with it.
Lastly, formatting the response can be done by providing the formatting function an iterable of the response content. The easiest one to come up with is a list, but it can also be any kind of generator.
All in all, I would write:
utils.py
from datetime import datetime, timedelta
import cgi
import pymysql
REQUEST_ARGS = cgi.FieldStorage()
METRICS_FORMATTERS = {
 "HumidityLog": lambda x: x,
 "BmpTempLog": lambda c: c * 1.8 + 32,
 "PressureLog": lambda p: p * 0.0002953,
 "AltitudeLog": lambda m: m * 3.28084,
 "TemperatureLog": lambda c: c * 1.8 + 32,
 "SeaPressureLog": lambda p: p * 0.0002953,
}
def connect_to_database():
 return pymysql.connect(
 db='WeatherLog',
 user='WeatherLog',
 passwd='Weather!',
 host='localhost')
def select_from_database(cursor, table, start_date, end_date, minute_grouping):
 cursor.execute("""
 SELECT Logged, Avg(Value)
 FROM %s
 WHERE Logged >= '%s' AND Logged <= '%s'
 GROUP BY ROUND(UNIX_TIMESTAMP(Logged)/(%s * 60));
 """, (table, start_date, end_date, minute_grouping))
 return cursor.fetchall()
def date_from_now(days_limit, fmt):
 earlier = datetime.utcnow() - timedelta(days=days_limit)
 return earlier.strftime(fmt)
def retrieve_start_and_end_date(days_limit=7, fmt="%Y-%m-%d %H:%M:%S"):
 date_start = REQUEST_ARGS.getvalue('Start') if 'Start' in REQUEST_ARGS else date_from_now(days_limit, fmt)
 end_date = REQUEST_ARGS.getvalue('End') if 'End' in REQUEST_ARGS else datetime.utcnow().strftime(fmt)
 return date_start, date_end
def send_response(content, headers=["Content-type: text/html"]):
 for header in headers:
 print header
 print
 for line in content:
 print line
index.py
import utils
def file_iterator(filename):
 with open(filename) as content:
 for line in content:
 yield line.rstrip()
if __name__ == '__main__':
 utils.send_response(file_iterator('index.html'))
latest.py
import utils
def metrics_fetcher():
 start_date, end_date = utils.retrieve_start_and_end_date()
 connection = utils.connect_to_database()
 with connection as cursor:
 for table, formatter in utils.METRICS_FORMATTER.iteritems():
 rows = utils.select_from_database(cursor, table, start_date, end_date, minute_grouping=1)
 for row in rows:
 yield '{}\t{}\t{}'.format(table[:-3], row[0], formatter(row[1]))
 connection.close()
if __name__ == '__main__':
 utils.send_response(metrics_fetcher())
history.py
import utils
def history_fetcher(default_table):
 table = utils.REQUEST_ARGS.getvalue('LogType') + 'Log' if 'LogType' in utils.REQUEST_ARGS else default_table
 try:
 formatter = utils.METRICS_FORMATTER[table]
 except KeyError:
 table = default_table
 formatter = utils.METRICS_FORMATTER[table]
 start_date, end_date = utils.retrieve_start_and_end_date()
 connection = utils.connect_to_database()
 with connection as cursor:
 rows = utils.select_from_database(cursor, table, start_date, end_date, minute_grouping=3)
 yield 'Logged\tValue'
 for row in rows:
 yield '{}\t{}'.format(row[0], formatter(row[1]))
 connection.close()
if __name__ == '__main__':
 utils.send_response(history_fetcher(default_table='TemperatureLog'))
Explore related questions
See similar questions with these tags.