I like to use timeit to measure performance of small, and sometimes big, functions. However it can be uncertain as to what the 'actual' time to execute the function is. It also doesn't clearly show trends in function execution times.
Originally I wanted to measure the difference between list comprehensions and using append continuously. I wanted it to be simple to use, and so tried to abstract the graphing as much as possible. This lead to having to provide the components to timeit at class level. And a flattened list of graphs at function/instance level.
My code still suffers from a couple of the above problems, but reduces them by a reasonable amount. The module is, 'graphtimer.py':
from timeit import timeit
from functools import partial
CATEGORY10 = '#1f77b4 #ff7f0e #2ca02c #d62728 #9467bd #8c564b #e377c2 #7f7f7f #bcbd22 #17becf'.split()
CATEGORY20 = '#1f77b4 #aec7e8 #ff7f0e #ffbb78 #2ca02c #98df8a #d62728 #ff9896 #9467bd #c5b0d5 #8c564b #c49c94 #e377c2 #f7b6d2 #7f7f7f #c7c7c7 #bcbd22 #dbdb8d #17becf #9edae5'.split()
CATEGORY20b = '#393b79 #5254a3 #6b6ecf #9c9ede #637939 #8ca252 #b5cf6b #cedb9c #8c6d31 #bd9e39 #e7ba52 #e7cb94 #843c39 #ad494a #d6616b #e7969c #7b4173 #a55194 #ce6dbd #de9ed6'.split()
CATEGORY20c = '#3182bd #6baed6 #9ecae1 #c6dbef #e6550d #fd8d3c #fdae6b #fdd0a2 #31a354 #74c476 #a1d99b #c7e9c0 #756bb1 #9e9ac8 #bcbddc #dadaeb #636363 #969696 #bdbdbd #d9d9d9'.split()
def _time(setup, fn, amount=1000, number=1000000, command='fn(a)'):
 return timeit(command, setup.format(fn, amount), number=number)
def time(*args, **kwargs):
 return partial(_time, *args, **kwargs)
def flat(axes):
 if 'flat' in dir(axes):
 return axes.flat
 try:
 return [axis for row in axes for axis in row]
 except TypeError:
 return [axes]
class GraphTimer:
 functions = []
 inputs = []
 domain = []
 titles = []
 colors = CATEGORY10
 def _average_and_error_area(self, axis):
 for results in axis:
 average = sum(results) / len(results)
 yield average, results[0], results[-1]
 def _average_and_error_line(self, axis):
 for results in axis:
 average = sum(results) / len(results)
 yield average, average - results[0], results[-1] - average
 def _remove_outliers(self, axis):
 length = len(axis)
 lo = length // 4
 up = (length - 1) - length // 4
 for results in zip(*axis):
 results = list(sorted(results))
 q1 = results[lo]
 q3 = results[up]
 interquartile = 1.5 * (q3 - q1)
 low = q1 - interquartile
 upp = q3 - interquartile
 yield [i for i in results if q1 <= i <= q3]
 def _average_error_area(self, axis):
 return zip(*self._average_and_error_area(self._remove_outliers(axis)))
 def _average_error(self, axis):
 return zip(*self._average_and_error_line(self._remove_outliers(axis)))
 def average_error(self, axis):
 return self._average_error_area(axis)
 def graph_time(self, plt, line, color, box_error=True):
 domain = list(self.domain)
 average, lower, upper = self.average_error(line)
 if box_error:
 plt.fill_between(domain, lower, upper, facecolor=color, color="none", alpha=0.1)
 return plt.plot(domain, average, color=color)[0]
 def graph_times(self, plt, axis, box_error=True, legend=True, title=None):
 lines = [
 self.graph_time(plt, axis, color, box_error=box_error)
 for axis, color in zip(axis, self.colors)
 ]
 if title is not None and 'set_title' in dir(plt):
 plt.set_title(title)
 if legend and 'legend' in dir(plt):
 plt.legend(lines, self.functions, loc=0)
 return lines
 def time_input(self, input, amount=10):
 domain = list(self.domain)
 return [
 [
 [input(function, amount=x) for x in domain]
 for _ in range(amount)
 ]
 for function in self.functions
 ]
 def time_inputs(self, amount=10):
 return (
 self.time_input(input, amount=amount)
 for input in self.inputs
 )
 def plot_axis(self, plt, input, amount=10, box_error=True, legend=True, title=None):
 time = self.time_input(input, amount=amount)
 return self.graph_times(plt, time, box_error=box_error, legend=legend, title=title)
 def plot_axes(self, plts, amount=10, box_error=True, legend=True, show_titles=False):
 times = self.time_inputs(amount=amount)
 titles = iter(self.titles if show_titles else [])
 return [
 self.graph_times(plt, time, box_error=box_error, legend=legend, title=next(titles, None))
 for plt, time in zip(plts, times)
 ]
Both of the functions _average_and_error_area and _average_and_error_line are there as I originally used errorbar rather than fill_between. And may add this back as an option.
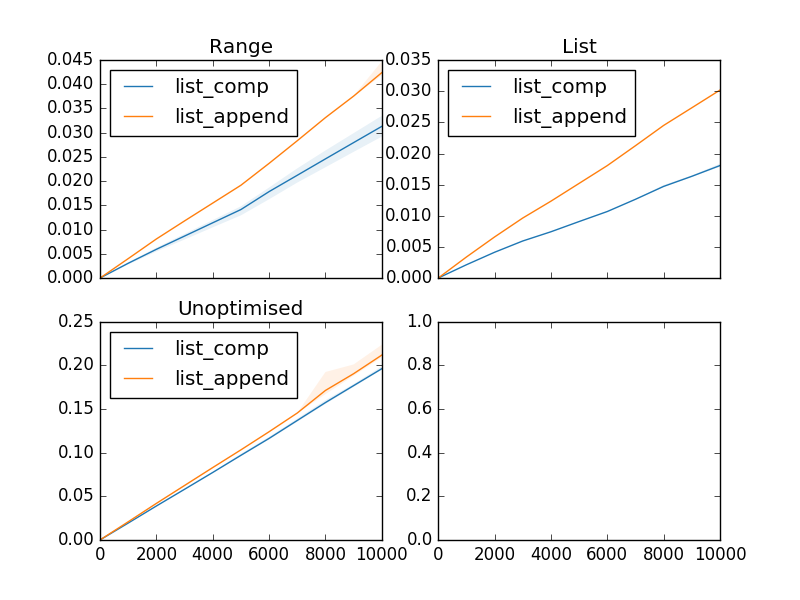
Where this is an example of how I would compare using append and a list comprehension:
from itertools import islice
class UnoptimisedRange(object):
 def __init__(self, size):
 self.size = size
 def __getitem__(self, i):
 if i >= self.size:
 raise IndexError()
 return i
def list_comp(iterable):
 return [i for i in iterable]
def list_append(iterable):
 a = []
 append = a.append
 for i in iterable:
 append(i)
 return a
import matplotlib.pyplot as plt
from graphtimer import time, flat, GraphTimer
class Timer(GraphTimer):
 functions = [
 'list_comp',
 'list_append',
 ]
 inputs = [
 time('from __main__ import {} as fn; a = range({})', number=100),
 time('from __main__ import {} as fn; a = list(range({}))', number=100),
 time('from __main__ import {} as fn, UnoptimisedRange as range; a = range({})', number=100),
 ]
 domain = list(range(0, 10001, 1000))
 titles = [
 'Range',
 'List',
 'Unoptimised',
 ]
def main():
 fig, axs = plt.subplots(nrows=2, ncols=2, sharex=True)
 Timer().plot_axes(flat(axs), amount=10, show_titles=True)
 plt.show()
if __name__ == '__main__':
 main()
This sometimes doesn't output the area, for an unknown reason. But I'm ok with that. And can output graphs such as:
Three cool graphs, to show output.
Note: There is a GitHub repo for this, licensed under MIT.
1 Answer 1
The first thing that hits me with this code, is how messy it looks. You sometimes have to go down 6 or 7 methods to understand what is going on. And all the way to it, some parameters are constantly changing names, which makes it pretty hard to follow. Some consistency and docstrings wouldn't hurt.
Second, there is a bunch of boilerplate code that could be avoided. Especially when defining inputs: grabing the function from the current namespace or wrapping the setup into a partial timeit call could be done automatically.
Lastly, instead of defining the number of run per setup, I would make it a parameter of the instance (à la timeit), so that each plot would be done with similar characteristics to the others. And even though timeit provide a repeat method to pass the amount of repetitions needed, I would also pass this one as an instance parameter, just to simplify a bit.
Having an __init__ method to store these instances parameters, you could also turn domains into a list there, since you do it rather often. And provide the boilerplate around inputs too.
In the following code, I also merged some methods together because I feel it simplifies the reading and they didn't seem to be there for a public use:
from timeit import timeit
from itertools import repeat
CATEGORY10 = '#1f77b4 #ff7f0e #2ca02c #d62728 #9467bd #8c564b #e377c2 #7f7f7f #bcbd22 #17becf'.split()
CATEGORY20 = '#1f77b4 #aec7e8 #ff7f0e #ffbb78 #2ca02c #98df8a #d62728 #ff9896 #9467bd #c5b0d5 #8c564b #c49c94 #e377c2 #f7b6d2 #7f7f7f #c7c7c7 #bcbd22 #dbdb8d #17becf #9edae5'.split()
CATEGORY20b = '#393b79 #5254a3 #6b6ecf #9c9ede #637939 #8ca252 #b5cf6b #cedb9c #8c6d31 #bd9e39 #e7ba52 #e7cb94 #843c39 #ad494a #d6616b #e7969c #7b4173 #a55194 #ce6dbd #de9ed6'.split()
CATEGORY20c = '#3182bd #6baed6 #9ecae1 #c6dbef #e6550d #fd8d3c #fdae6b #fdd0a2 #31a354 #74c476 #a1d99b #c7e9c0 #756bb1 #9e9ac8 #bcbddc #dadaeb #636363 #969696 #bdbdbd #d9d9d9'.split()
def time(setup, param='a'):
 def wrapper(function, domain_value, number):
 user_setup = setup.format(domain_value)
 return timeit(
 '{}({})'.format(function, param),
 setup="from __main__ import {}; {}".format(function, user_setup),
 number=number)
 return wrapper
def flat(axes):
 if hasattr(axes, flat):
 return axes.flat
 try:
 return [axis for row in axes for axis in row]
 except TypeError:
 return [axes]
class GraphTimer:
 functions = []
 inputs = []
 domain = []
 titles = []
 colors = CATEGORY10
 def __init__(self, amount, number):
 self.amount = amount
 self.number = number
 self.setups = [
 time(setup) if isinstance(setup, str) else setup
 for setup in self.inputs]
 self.domain_values = list(self.domain)
 def time_input(self, input):
 return [
 [
 self.average_measure(input, function, value)
 for value in self.domain_values
 ] for function in self.functions
 ]
 def average_measure(self, input, function, value):
 results = sorted(input(function, value, self.number)
 for _ in range(self.amount))
 lower = amount // 4
 upper = amount - lower - 1
 q1 = results[lower]
 q3 = results[upper]
 conforming = [i for i in results if q1 <= i <= q3]
 mean = sum(conforming) / len(conforming)
 return mean, q1, q3
 def graph_times(self, axis, data, box_error=True, legend=True, title=None, use_errorbar=False):
 for results, color in zip(data, self.colors):
 stats = self.error_line(results) if use_errorbar else results
 average, lower, upper = zip(*stats)
 if box_error:
 if use_errorbar:
 axis.errorbar(...)
 else:
 axis.fill_between(self.domain_values, lower, upper, facecolor=color, color="none", alpha=0.1)
 yield axis.plot(self.domain_values, average, color=color)[0]
 if title is not None and hasattr(axis, 'set_title'):
 axis.set_title(title)
 if legend and hasattr(axis, 'legend'):
 axis.legend(lines, self.functions, loc=0)
 @staticmethod
 def error_line(results):
 for average, minimum, maximum in results:
 yield average, average - minimum, maximum - average
 def plot_axis(self, axis, input, box_error=True, legend=True, title=None, use_errorbar=False):
 times = self.time_input(input)
 return list(self.graph_times(axis, times, box_error, legend, title, use_errorbar))
 def plot_axes(self, axes, box_error=True, legend=True, show_titles=False, use_errorbar=False):
 titles = self.titles if show_titles else repeat(None)
 return [
 self.plot_axis(axis, input, box_error, legend, title, use_errorbar)
 for axis, input, title in zip(axes, self.setups, titles)
 ]
Some tiny improvements too, such as using hasattr instead of dir; or providing our own wrapper around timeit to allow for better control than partial did. I also tried to incorporate an option for errorbar.
Usage being along the lines of:
class UnoptimisedRange(object):
 def __init__(self, size):
 self.size = size
 def __getitem__(self, i):
 if i >= self.size:
 raise IndexError()
 return i
def list_comp(iterable):
 return [i for i in iterable]
def list_append(iterable):
 a = []
 append = a.append
 for i in iterable:
 append(i)
 return a
import matplotlib.pyplot as plt
class Timer(GraphTimer):
 functions = [
 'list_comp',
 'list_append',
 ]
 inputs = [
 'a = range({})',
 'a = list(range({}))',
 'from __main__ import UnoptimisedRange; a = UnoptimizedRange({})',
 ]
 domain = range(0, 10001, 1000)
 titles = [
 'Range',
 'List',
 'Unoptimised',
 ]
def main():
 fig, axs = plt.subplots(nrows=2, ncols=2, sharex=True)
 Timer(amount=10, number=100).plot_axes(flat(axs), show_titles=True)
 plt.show()
if __name__ == '__main__':
 main()
One last thing, that I’m a bit unsure of, but I can't figure a way that satisfies me much, would be to tie more closely each input and the associated title.
One way of looking at that would be to modify time to also store and return the titles:
def time(setup, param='a', title=None):
 def wrapper(function, domain_value, number):
 user_setup = setup.format(domain_value)
 return timeit(
 '{}({})'.format(function, param),
 setup="from __main__ import {}; {}".format(function, user_setup),
 number=number)
 return wrapper, title
class GraphTimer:
 functions = []
 inputs = []
 domain = []
 colors = CATEGORY10
 def __init__(self, amount, number):
 self.amount = amount
 self.number = number
 inputs = (
 time(setup) if isinstance(setup, str) else setup
 for setup in self.inputs)
 self.setups, self.titles = zip(*inputs)
 self.domain_values = list(self.domain)
 ...
 def plot_axes(self, axes, box_error=True, legend=True, show_titles=False, use_errorbar=False):
 return [
 self.plot_axis(axis, input, box_error, legend, title, use_errorbar)
 for axis, input, title in zip(axes, self.setups, self.titles)
 ]
But it somehow forces the use of time into the definition of inputs:
class Timer(GraphTimer):
 functions = [
 'list_comp',
 'list_append',
 ]
 inputs = [
 time('a = range({})', title='Range'),
 time('a = list(range({}))', title='List'),
 time('from __main__ import UnoptimisedRange; a = UnoptimizedRange({})', title='Unoptimized'),
 ]
 domain = range(0, 10001, 1000)
-
\$\begingroup\$ Your changes are great and improve the readability of both parts of the code more than I originally thought, thank you. Also, this may be rude of me, but as this is a large edit, would you be willing to provide this code under both CC-BY-SA and MIT, so I could add your changes to it in my repo? \$\endgroup\$2016年11月08日 15:19:49 +00:00Commented Nov 8, 2016 at 15:19
-
\$\begingroup\$ @JoeWallis Sure, I don't mind at all. Do I need to put a mention of some sort somewhere? \$\endgroup\$301_Moved_Permanently– 301_Moved_Permanently2016年11月08日 16:53:58 +00:00Commented Nov 8, 2016 at 16:53
-
\$\begingroup\$ I don't actually know, unfortunately IANAL. I would assume you could add something like: "disclaimer: Due to authors requests, code in this answer is also licensed under MIT". I guess you could alternately push to my repo. \$\endgroup\$2016年11月08日 17:02:24 +00:00Commented Nov 8, 2016 at 17:02
Explore related questions
See similar questions with these tags.
_remove_outliersyou computelowanduppbut never use them, is it expected or did you forget to use them in the following comprehension? \$\endgroup\$lowanduppare not used. \$\endgroup\$