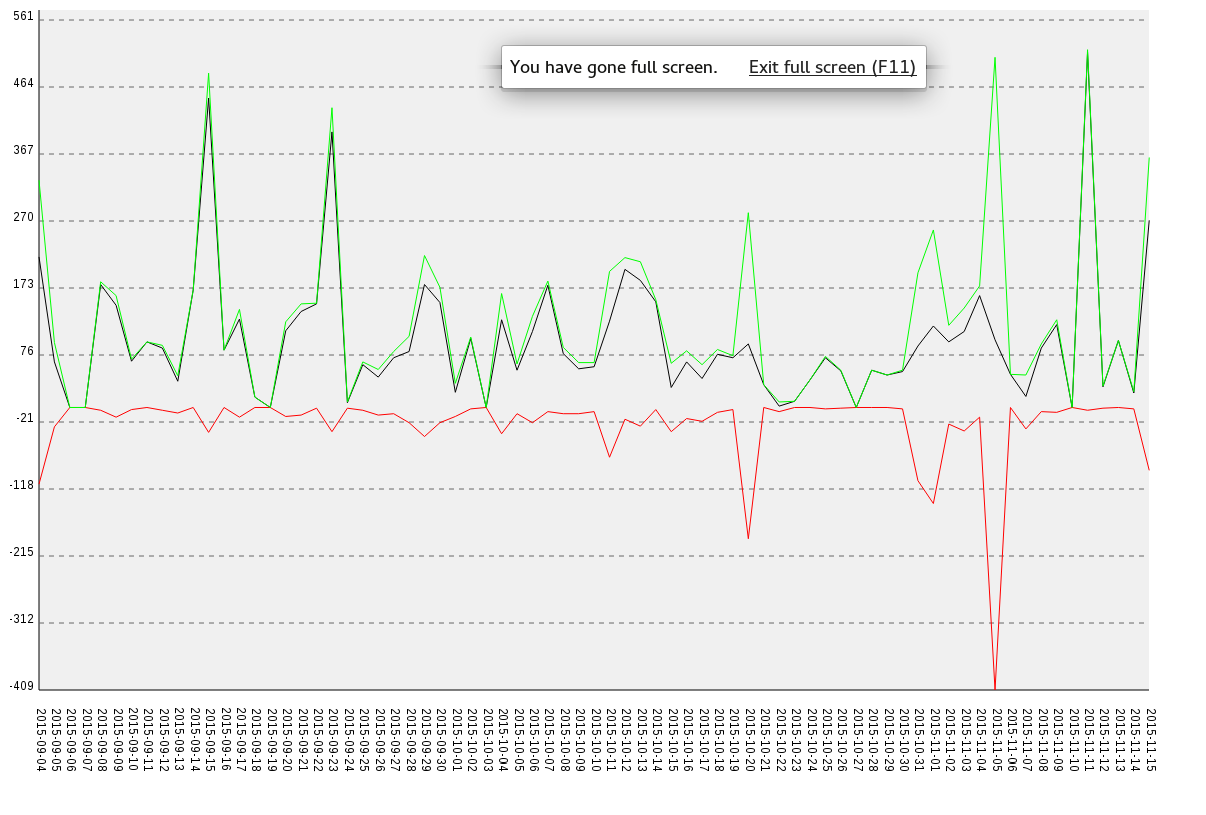
I attempted to recreate the GitHub code frequency graph (example) with a daily granularity using Perl and git log. How did I do, and what improvements can I make? I know that I should try to reduce the frequency of keys on the x-axis, but I have no idea how to do that and maintain scale.
It should be noted that the default application for open SVG files should be set to a browser of some sort.
#!/usr/bin/env perl
# Henry J Schmale
# November 4, 2015
#
# Creates an insertion and delation graph per day graph for a git repo. It
# outputs an svg of the graph on standard output.
#
# This script can take the name of a directory to produce the graph for
# that directory if no param is given, then it does it in the current
# directory.
#
# Requires SVG::TT:Graph::Line
use strict;
use warnings;
# Get the path to the stylesheet first
use File::Spec;
use File::Basename;
my $graphsty = dirname(File::Spec->rel2abs(__FILE__)) . '/svg-graph-ss.css';
# CD into the directory specified if specified
if(-e $ARGV[0] and -d $ARGV[0]){
 chdir $ARGV[0];
}
# Indexed by date
my %commits;
# get the git log and preprocess it
my $gitlogOutput = qx(git log --numstat --pretty="%H %aI" | grep -v '^\$');
my @lines = split /\n/, $gitlogOutput;
my $date;
my $hash;
foreach (@lines) {
 chomp;
 my @fields = split /\s+/;
 # Length of sha1sum
 if(length($fields[0]) > 39){
 $hash = $fields[0];
 $date = substr($fields[1], 0, 10);
 }else{
 $commits{$date}->{ins} += $fields[0];
 $commits{$date}->{del} += $fields[1];
 }
}
use DateTime;
use Date::Parse;
use Data::Dumper;
my $firstDate = getDateTime(((sort keys %commits)[0]));
my $lastDate = getDateTime(((sort keys %commits)[-1]));
# print "$firstDate\t".((sort keys %commits)[0])."\n";
# print "$lastDate\t".((sort keys %commits)[-1])."\n";
# print (scalar keys %commits)."\n";
while($firstDate->add(days => 1) < $lastDate){
 my $key = $firstDate->ymd('-');
 if(!defined $commits{$key}){
 $commits{$key}->{ins} = 0;
 $commits{$key}->{del} = 0;
 }
}
# print scalar keys %commits;
# print "\n";
# Prepare data for graphing by converting them to arrays
my (@key, @ins, @del, @net);
my $i = 0;
foreach (sort keys %commits){
 $key[$i] = $_;
 $ins[$i] = $commits{$_}{ins};
 # del must be negitive in order for graph to look right, with delations
 # being below the x axis.
 $del[$i] = -$commits{$_}{del};
 $net[$i] = $commits{$_}{ins} - $commits{$_}{del};
 # printf("%s,%s,%s,%s\n", $_, $ins[$i], $del[$i], $net[$i]);
 $i++;
}
# Get the max value in the data sets
my @allpoints;
my ($min, $max);
push @allpoints, @ins;
push @allpoints, @del;
push @allpoints, @net;
for(@allpoints){
 $min = $_ if !$min || $_ < $min;
 $max = $_ if !$max || $_ > $max;
}
# Graph it
use SVG::TT::Graph::Line;
my $graph = SVG::TT::Graph::Line->new({
 width => 1200,
 height => 800,
 fields => \@key,
 scale_integers => 1,
 rotate_x_labels => 1,
 show_data_values => 0,
 show_data_points => 0,
 min_scale_value => $min,
 max_scale_value => $max,
 style_sheet => $graphsty,
 });
# Add the data
$graph->add_data({
 'data' => \@ins,
 title => 'Inserts Per Day'
 });
$graph->add_data({
 'data' => \@del,
 title => 'Deletions Per Day'
 });
$graph->add_data({
 'data' => \@net,
 title => 'Net Insert/Del Per Day'
 });
# Print file
my $filepath = '/tmp/gitGraph.svg';
open my $FD,'>',$filepath or die $!;
print $FD $graph->burn();
close $FD;
# Open it up in the browser or prefered method for opening the file
$filepath = 'file://'.$filepath;
qx(xdg-open $filepath);
sub getDateTime {
 my ($ss,$mm,$hh,$day,$month,$year,$zone) = strptime($_[0]);
 # print "\t$_[0]\n";
 return DateTime->new(
 day => $day,
 month => $month + 1,
 # We have to add 1900 here inorder to make the date format work
 year => ($year + 1900)
 );
}
2 Answers 2
A simple thing to add would be a Logarithmic Y-scaling function, so that significant bursts in either losses or gains don't get over-exaggerated perceptually. Essentially you want 100-commit days to only take up at most, 10x as much space as 1 commit days, so "low activity" wavering is still visible.
I'd also suggest breaking windows of about 7 days into single data points, by aggregating them and representing them as 5 lines each:
- Max number of commits per day in 7-day-range,
- Upper Quartile number of commits per day in 7-day-range
- Median number of commits per day ...
- Lower Quartile ....
- Min...
And then render it with some shades like this ( half-assed mockup )
With this, you could afford to narrow the sample window to "per hour" say, but still represent the data accumulated in terms of weeks, so you'd have "max commits/hour this week", "min commits/hour this week", etc, all represented in a single vertical column.
-
1\$\begingroup\$ IMO a CR post almost always should include some code (or at least a reference to original code) otherwise it's more about UX (which is good and desiderable but maybe off-topic) \$\endgroup\$Adriano Repetti– Adriano Repetti2016年04月29日 11:44:24 +00:00Commented Apr 29, 2016 at 11:44
-
1\$\begingroup\$ I mostly agree. But here it's not entirely obvious what the author is asking for, seems like they're wanting both. The code ... is ... well, more scary than I can begin to start on :/ \$\endgroup\$Kent Fredric– Kent Fredric2016年04月29日 12:21:53 +00:00Commented Apr 29, 2016 at 12:21
Overview
It is great that you:
- Used
strictandwarnings - Leveraged other people's code by using the CPAN modules
- Used comments at the top of the file to describe the code
Here are some adjustments for you to consider, mainly for coding style.
Warning
I get a warning if I don't specify a directory on the command line.
The -e file test isn't doing what you expect. It does not check
if the argument was passed in. This is one way to do it:
# If a directory is specified on the command line, change into it
chdir $ARGV[0] if $ARGV[0] and -d $ARGV[0];
Modules
It is customary to place all the use statements together at the top
of the file:
Since this is not used, just delete the line:
use Data::Dumper;
Namespace
It is best to import only what is needed to avoid namespace pollution. For example, change:
use File::Basename;
to:
use File::Basename qw(dirname);
These are all the use statements:
use strict;
use warnings;
use File::Spec qw();
use File::Basename qw(dirname);
use DateTime qw();
use Date::Parse qw(strptime);
use SVG::TT::Graph::Line qw();
Provide more debugging information to the user (the file name) if open
fails. Change:
open my $FD,'>',$filepath or die $!;
to:
open my $FD, '>', $filepath or die "$filepath $!";
There is no need for the following scalar variable and for split:
my $gitlogOutput = qx(git log --numstat --pretty="%H %aI" | grep -v '^\$');
my @lines = split /\n/, $gitlogOutput;
Simplified as:
my @lines = qx(git log --numstat --pretty="%H %aI" | grep -v '^\$');
The $hash variable is declared and set, but it is never read. It can
be deleted.
Since you don't use the @allpoints array anywhere else, you can
get rid of the variable and simplify all these lines:
my @allpoints;
push @allpoints, @ins;
push @allpoints, @del;
push @allpoints, @net;
for(@allpoints){
as:
for (@ins, @del, @net) {
Since the "quote executable" operator interpolates variables, you can simplify these 2 lines:
$filepath = 'file://'.$filepath;
qx(xdg-open $filepath);
as:
qx(xdg-open file://$filepath);
There is no need for the single quotes around the data key:
$graph->add_data({
 'data' => \@ins,
 title => 'Inserts Per Day'
It would be more consistent to omit them as you did for the title key:
$graph->add_data({
 data => \@ins,
 title => 'Inserts Per Day'
Since foreach is identical to for, and you already use for
elsewhere in the code, you should just use for everywhere.
use SVG::TT::Graph::Line;should be at the top. So should the otherusestatements that are in the middle. They will all be loaded at compile time anyway. \$\endgroup\$