- TypeScript 53.3%
- Go 42.9%
- HTML 1.2%
- CSS 0.9%
- Makefile 0.8%
- Other 0.9%
| .github | Release 2.1.4 (#72,#74,#135,#195,#196) | |
| assets | Screenshots | |
| backend | Fix WOL button | |
| docs | README and API doc | |
| frontend | Fix WOL button | |
| .gitignore | Conf and models | |
| .version | Swagger API docs | |
| CHANGELOG.md | Release 2.1.4 (#72,#74,#135,#195,#196) | |
| docker-compose-auth.yml | Auth upd | |
| docker-compose.yml | Release 2.1.0 (#180,#181) | |
| Dockerfile | Swagger API docs | |
| FAQ.md | FAQ.md | |
| LICENSE | Basic gin site | |
| README.md | README upd | |
WatchYourLAN
Docker Go Report Card Docker Image Size (latest semver) GitHub Discussions
aceberg%2FWatchYourLAN | Trendshift
Lightweight network IP scanner with web GUI. Features:
- Send notification when new host is found
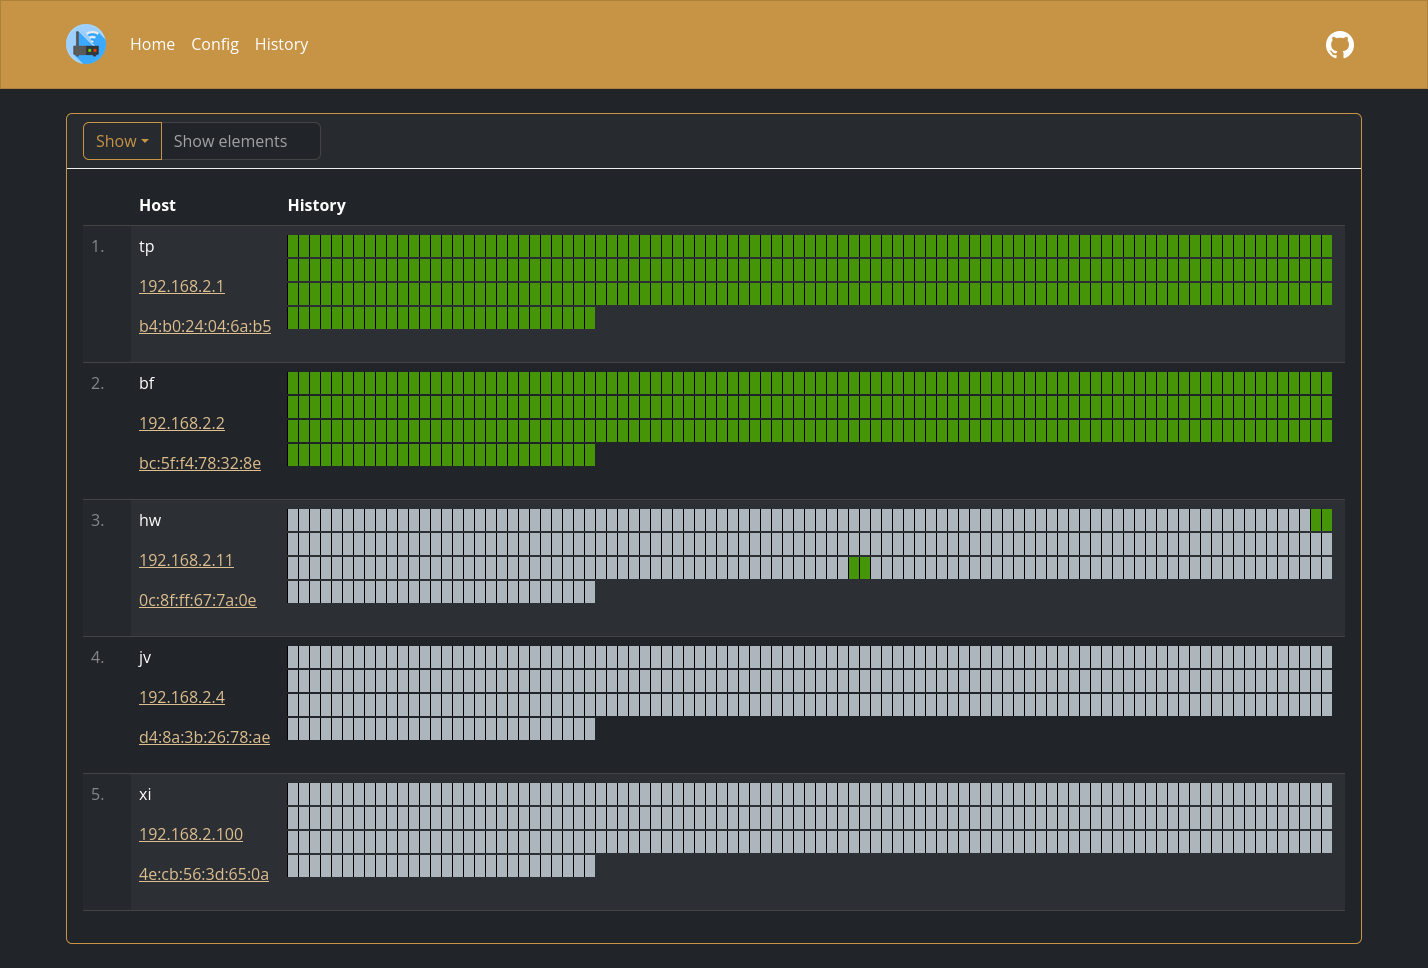
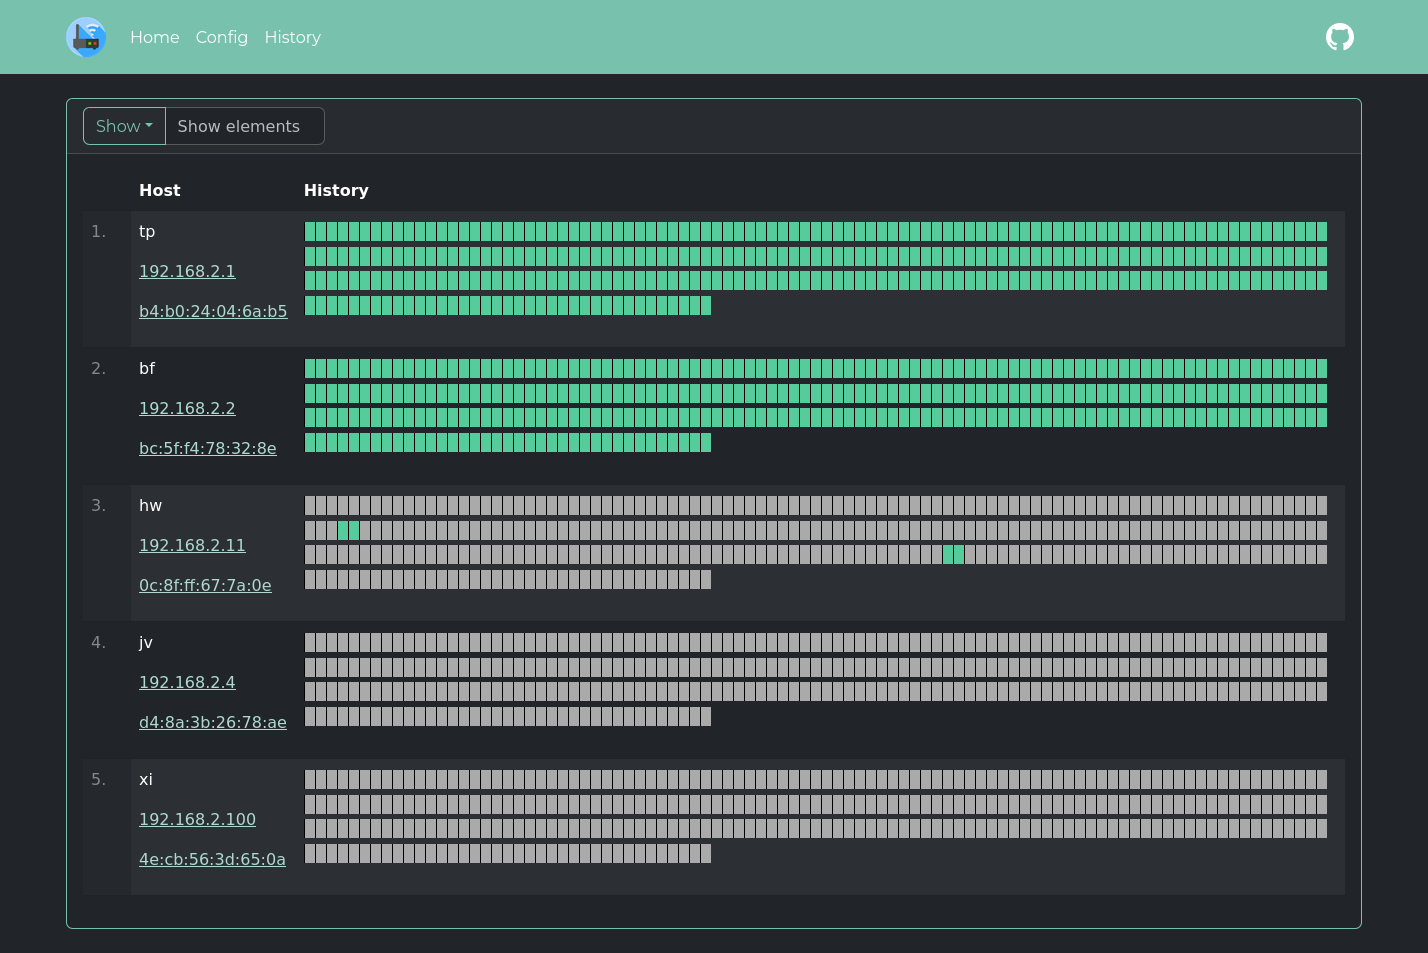
- Monitor hosts online/offline history
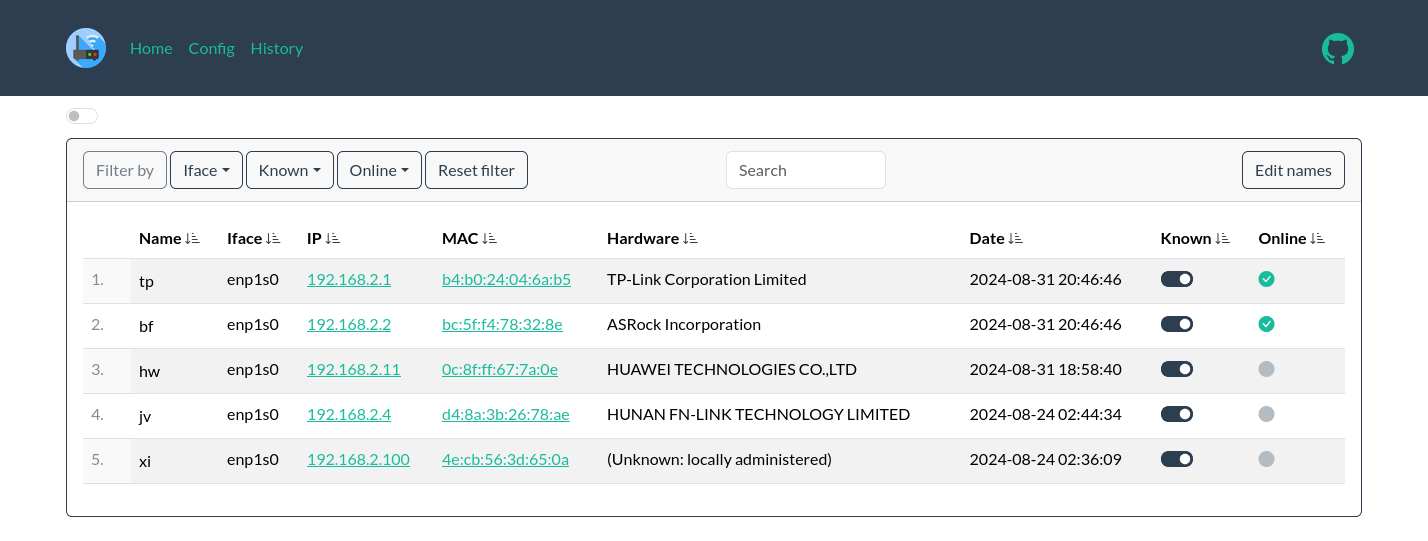
- Keep a list of all hosts in the network
- Send data to
InfluxDB2orPrometheusto make aGrafanadashboard
Important
Please, consider making a donation. Even 10ドル will make a difference to me.
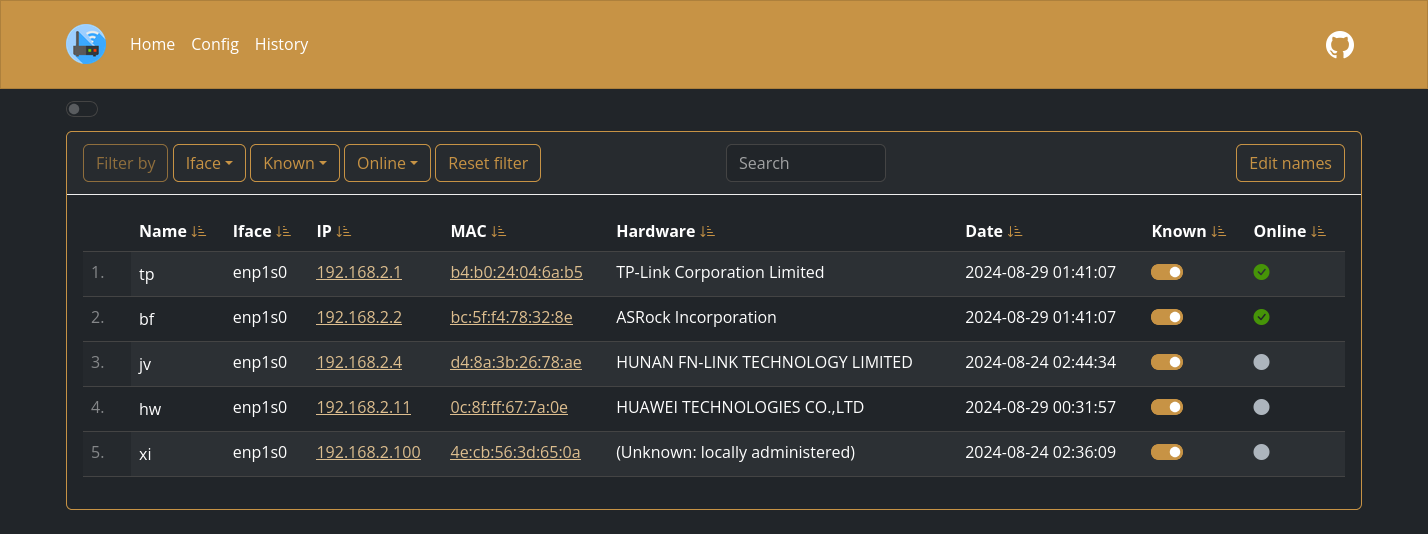
More screenshots

Quick start
Expand
Replace $YOURTIMEZONE with correct time zone and $YOURIFACE with network interface you want to scan. Network mode must be host. Set $DOCKERDATAPATH for container to save data:
docker run --name wyl \
	-e "IFACES=$YOURIFACE" \
	-e "TZ=$YOURTIMEZONE" \
	--network="host" \
	-v $DOCKERDATAPATH/wyl:/data/WatchYourLAN \
 aceberg/watchyourlan
Web GUI should be at http://localhost:8840
Auth
Expand
WatchYourLAN does not have built-in auth option. But you can use it with SSO tools like Authelia, or my simple auth app ForAuth.
Here is an example docker-compose-auth.yml.
⚠️ WARNING!
Please, don't forget that WYL needshostnetwork mode to work. So, WYL port will be exposed in this setup. You need to limit access to it with firewall or other measures.
Install on Linux
Expand
All binary packages can be found in latest release. There are .deb, .rpm, .apk (Alpine Linux) and .tar.gz files.
Supported architectures: amd64, i386, arm_v5, arm_v6, arm_v7, arm64.
Dependencies: arp-scan, tzdata.
For amd64 there is a deb repo available
Config
Expand
Configuration can be done through config file, GUI or environment variables. Variable names is config_v2.yaml file are the same, but in lowcase.
Basic config
| Variable | Description | Default |
|---|---|---|
| TZ | Set your timezone for correct time | |
| HOST | Listen address | 0.0.0.0 |
| PORT | Port for web GUI | 8840 |
| THEME | Any theme name from https://bootswatch.com in lowcase or additional | sand |
| COLOR | Background color: light or dark | dark |
| NODEPATH | Path to local node modules | |
| SHOUTRRR_URL | WatchYourLAN uses Shoutrrr to send notifications. It is already integrated, just needs a correct URL. Examples for Discord, Email, Gotify, Matrix, Ntfy, Pushover, Slack, Telegram, Generic Webhook and etc are here |
Scan settings
| Variable | Description | Default |
|---|---|---|
| IFACES | Interfaces to scan. Could be one or more, separated by space. See docs/VLAN_ARP_SCAN.md. | |
| TIMEOUT | Time between scans (seconds) | 120 |
| ARP_ARGS | Arguments for arp-scan. Enable debug log level to see resulting command. (Example: -r 1). See docs/VLAN_ARP_SCAN.md. |
|
| ARP_STRS ARP_STRS_JOINED | See docs/VLAN_ARP_SCAN.md. | |
| LOG_LEVEL | Log level: debug, info, warn or error |
info |
| TRIM_HIST | Remove history after (hours) | 48 |
| HIST_IN_DB | DEPRECATED since 2.1.3. Now History is always stored in DB. Use TRIM_HIST to reduce DB size | |
| USE_DB | Either sqlite or postgres |
sqlite |
| PG_CONNECT | Address to connect to PostgreSQL. (Example: postgres://username:password@192.168.0.1:5432/dbname?sslmode=disable). Full list of URL parameters here |
InfluxDB2 config
This config matches Grafana's config for InfluxDB data source
| Variable | Description | Default | Example |
|---|---|---|---|
| INFLUX_ENABLE | Enable export to InfluxDB2 | false | true |
| INFLUX_SKIP_TLS | Skip TLS Verify | false | true |
| INFLUX_ADDR | Address:port of InfluxDB2 server | https://192.168.2.3:8086/ | |
| INFLUX_BUCKET | InfluxDB2 bucket | test | |
| INFLUX_ORG | InfluxDB2 org | home | |
| INFLUX_TOKEN | Secret token, generated by InfluxDB2 |
Prometheus config
This config configures the Prometheus data source
| Variable | Description | Default | Example |
|---|---|---|---|
| PROMETHEUS_ENABLE | Enable the Prometheus /metrics endpoint |
false | true |
Config file
Expand
Config file name is config_v2.yaml. Example:
arp_args:""color:darkhost:0.0.0.0ifaces:enp4s0influx_addr:""influx_bucket:""influx_enable:falseinflux_org:""influx_skip_tls:falseinflux_token:""log_level:infonodepath:""pg_connect:""port:"8840"prometheus_enable:falseshoutrrr_url:"gotify://192.168.0.1:8083/AwQqpAae.rrl5Ob/?title=Unknown host detected&DisableTLS=yes"theme:sandtimeout:60trim_hist:48use_db:sqliteOptions
Expand
| Key | Description | Default |
|---|---|---|
| -d | Path to config dir | /data/WatchYourLAN |
| -n | Path to node modules (see below) |
Local network only
Expand
By default, this app pulls themes, icons and fonts from the internet. But, in some cases, it may be useful to have an independent from global network setup. I created a separate image with all necessary modules and fonts. Run with Docker:
docker run --name node-bootstrap \
 -p 8850:8850 \
 aceberg/node-bootstrap
docker run --name wyl \
	-e "IFACES=$YOURIFACE" \
	-e "TZ=$YOURTIMEZONE" \
	--network="host" \
	-v $DOCKERDATAPATH/wyl:/data/WatchYourLAN \
 aceberg/watchyourlan -n "http://$YOUR_IP:8850"
Or use docker-compose
API & Integrations
Expand
API
Moved to docs/API.md
Integrations
- ArchLinux (AUR) by
gilcu3 - Python API client by drwahl
- Umbrel by Jasper
- YunoHost
Thanks
Expand
- All go packages listed in dependencies
- Favicon and logo: Access point icons created by Freepik - Flaticon
- Bootstrap
- Themes: Free themes for Bootstrap