This package provide a user-friendly interface to AWX data, it can read 3 type AWX, that is
- Product Type 1, geostationary satellite image product
- Product Type 2, polar orbiting satellite image product
- Product Type 3, Grid product
install from pypi
pip install awx
1 Read data, access data values, slicing longitude and latitude and save to netCDF
import os
from awx import Awx
pathfile = r'../sampledata/ANI_VIS_R02_20230217_1000_FY2G.AWX'
ds = Awx(pathfile)
# print file head information
print(ds)
# get satellite observation data in xarray.DataArray format
print(ds.values)
# clip data to given longitude and latitude extent
print(ds.sel(lat=slice(20, 40), lon=slice(100, 130)))
# save data to netcdf4
ds.values.to_netcdf('ANI_VIS_R02_20230217_1000_FY2G.nc')
2 Basic draw data without projection
# draw data use matplotlib
import matplotlib.pyplot as plt
from awx import Awx
fpath = r'./sampledata/ANI_VIS_R02_20230217_1000_FY2G.AWX'
ds = Awx(pathfile=fpath)
print(ds)
dar = ds.values.squeeze()
plt.pcolormesh(dar.lon, dar.lat, dar, cmap='Greys_r')
plt.savefig('ANI_VIS_R02_20230217_1000_FY2G_NoProj.png', dpi=300)
plt.show()
ANI_VIS_R02_20230308_1400_FY2G_NoProj.png
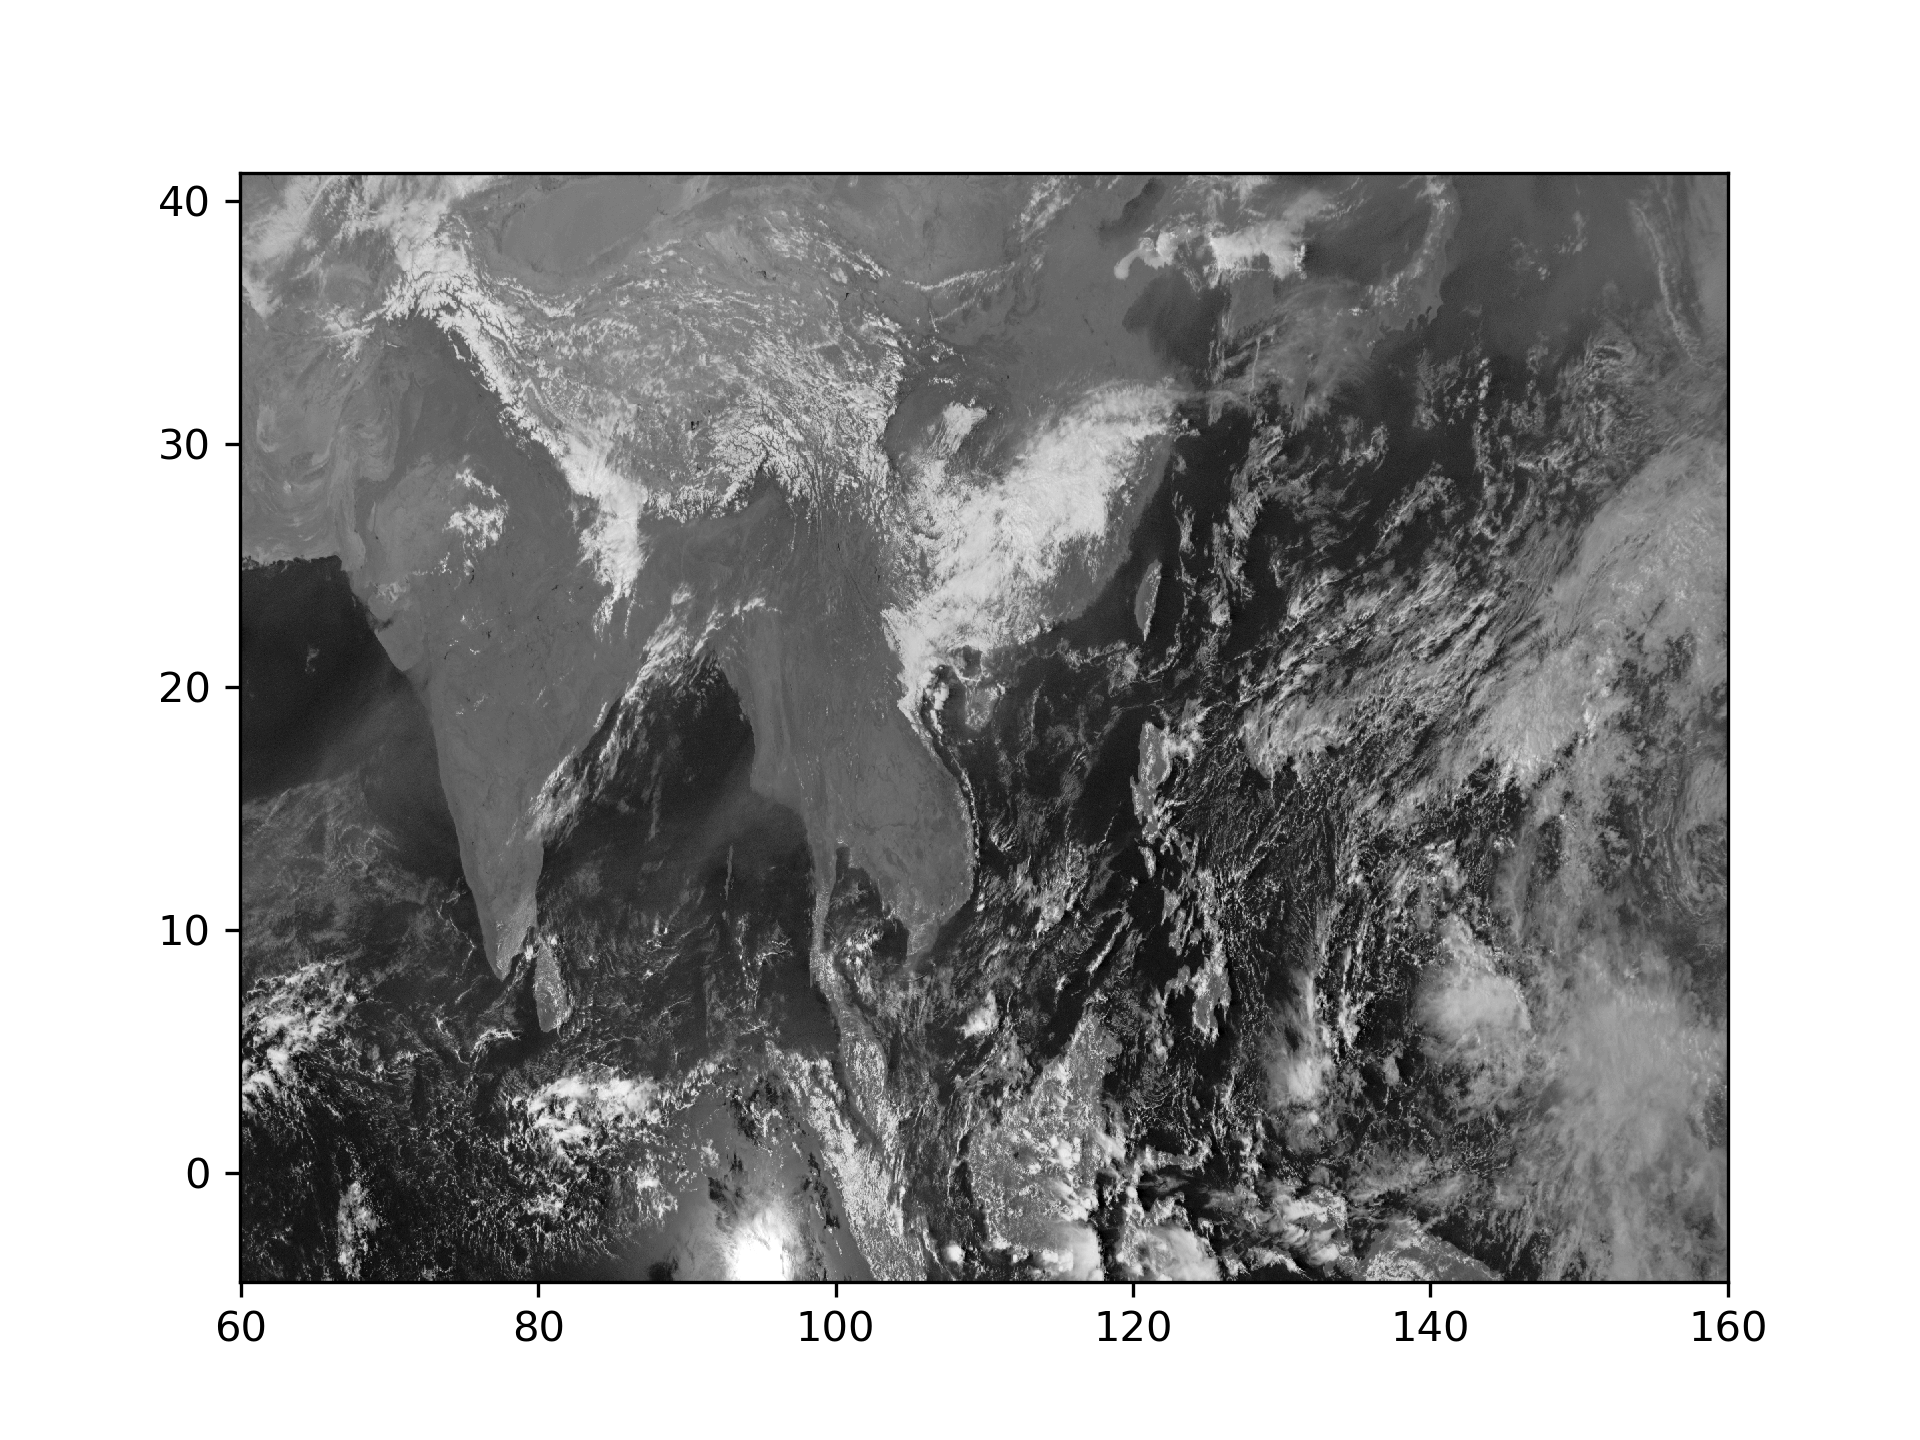
3 Draw data in native projection
# draw data in projection coordination
import os
import cartopy.crs as ccrs
import matplotlib.pyplot as plt
from awx import Awx
# fpath = r'./sampledata/ANI_VIS_R02_20230308_1400_FY2G.AWX' # Mercator
fpath = r'./sampledata/ANI_VIS_R01_20230308_1400_FY2G.AWX' # lambert
ds = Awx(pathfile=fpath)
print(ds)
dar = ds.values.squeeze()
plt.figure(figsize=(8, 8))
if dar.projection == 1:
 proj = ccrs.LambertConformal(central_longitude=dar.clon / 100,
 central_latitude=dar.clat / 100,
 standard_parallels=(dar.std_lat1_or_lon / 100.,
 dar.std_lat2 / 100.))
 extent = [dar.x.min(), dar.x.max(), dar.y.min(), dar.y.max()]
elif dar.projection == 2:
 proj = ccrs.Mercator(central_longitude=dar.clon / 100,
 latitude_true_scale=dar.std_lat1_or_lon / 100.)
 extent = [dar.x.min(), dar.x.max(), dar.y.min(), dar.y.max()]
elif dar.projection == 4:
 proj = ccrs.PlateCarree(central_longitude=dar.clon / 100.)
 extent = [dar.lon.min(), dar.lon.max(), dar.lat.min(), dar.lat.max()]
else:
 raise NotImplementedError()
ax = plt.axes(projection=proj)
ax.set_extent(extent, crs=proj)
ax.coastlines(resolution='110m')
ax.gridlines(draw_labels=True)
ax.pcolormesh(dar.x, dar.y, dar, cmap='Greys_r')
plt.savefig(os.path.splitext(os.path.basename(fpath))[0] + '.png', dpi=300, bbox_inches='tight')
plt.show()
ANI_VIS_R02_20230308_1400_FY2G.png
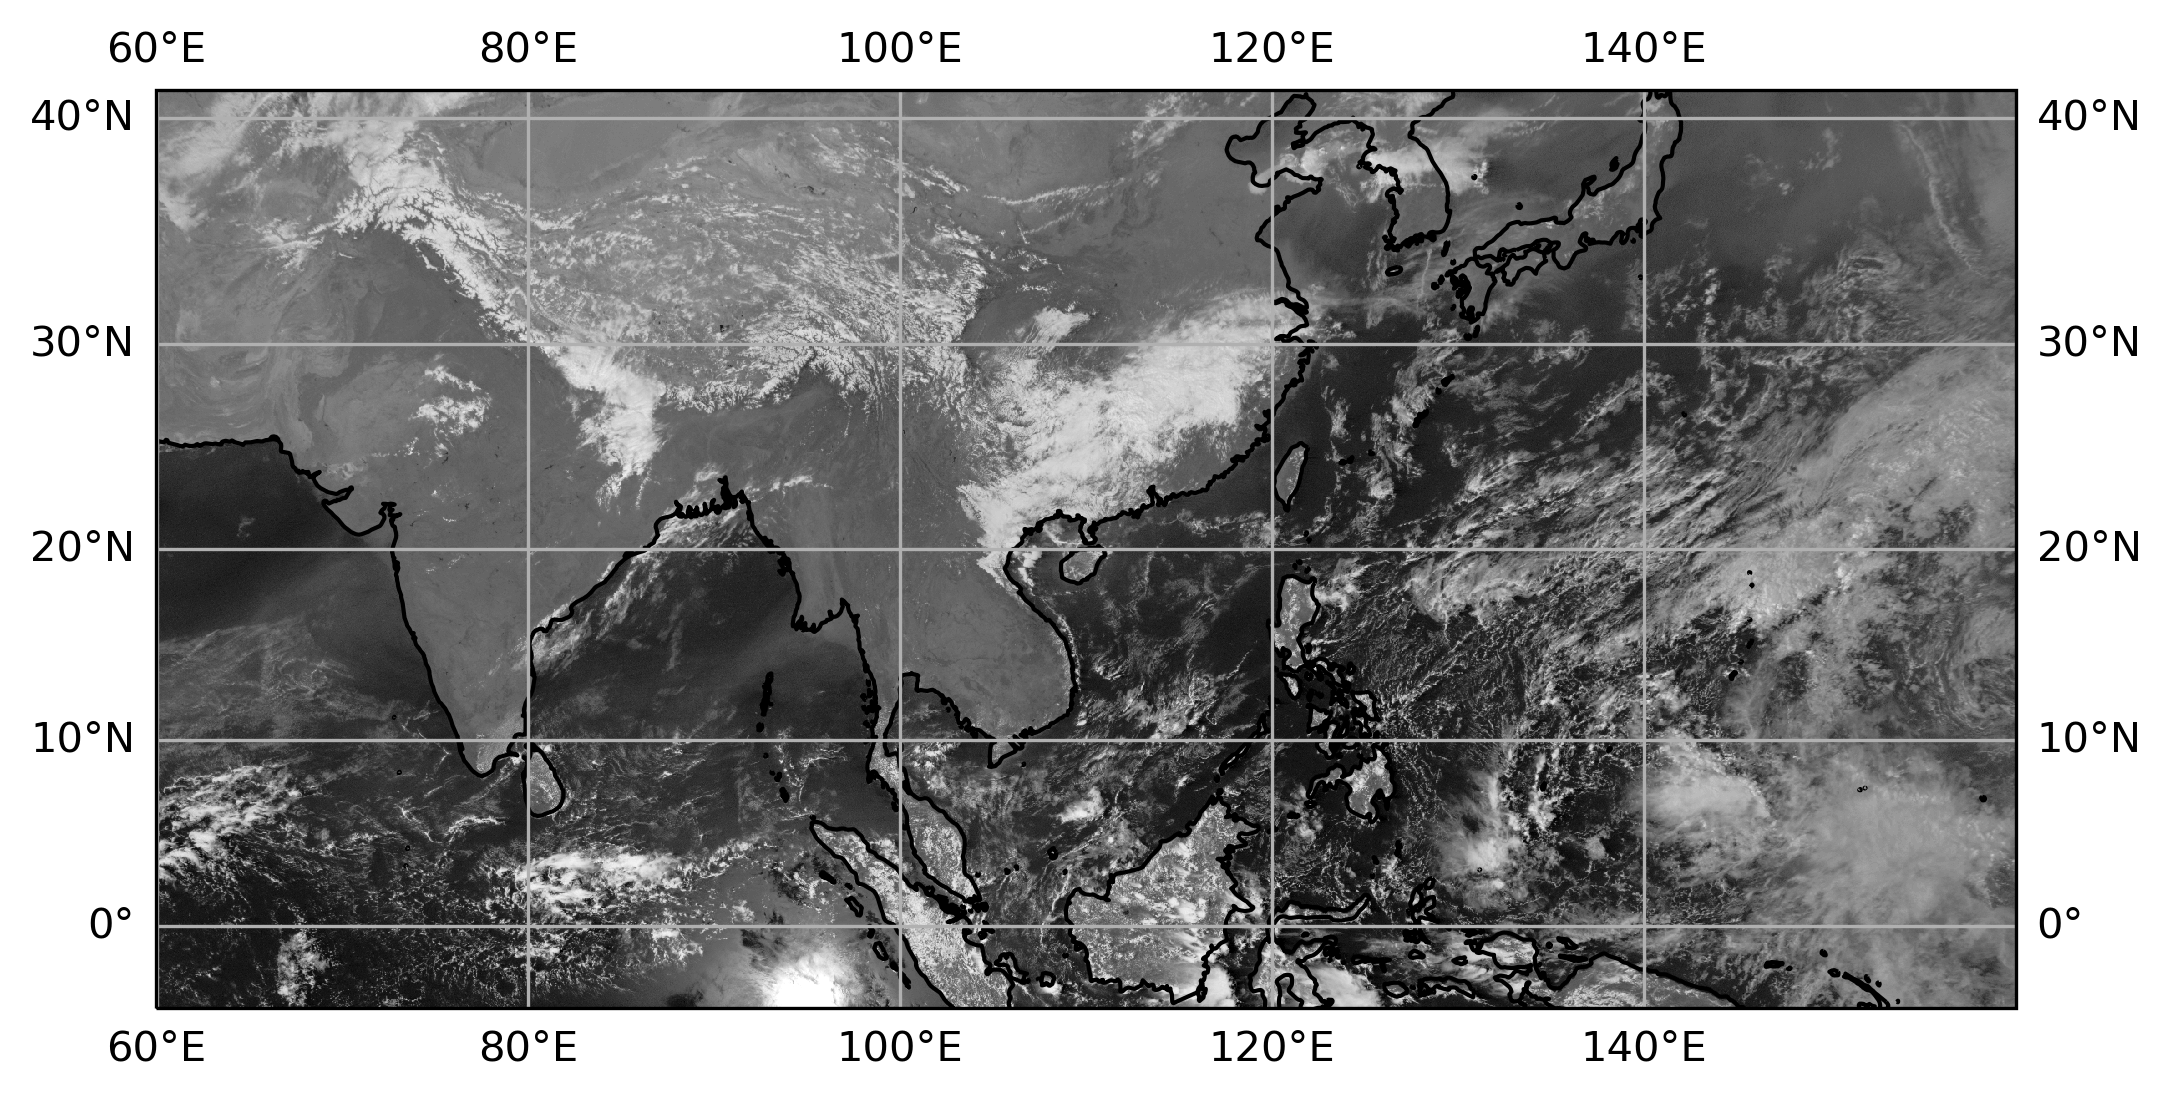
ANI_VIS_R01_20230308_1400_FY2G.png
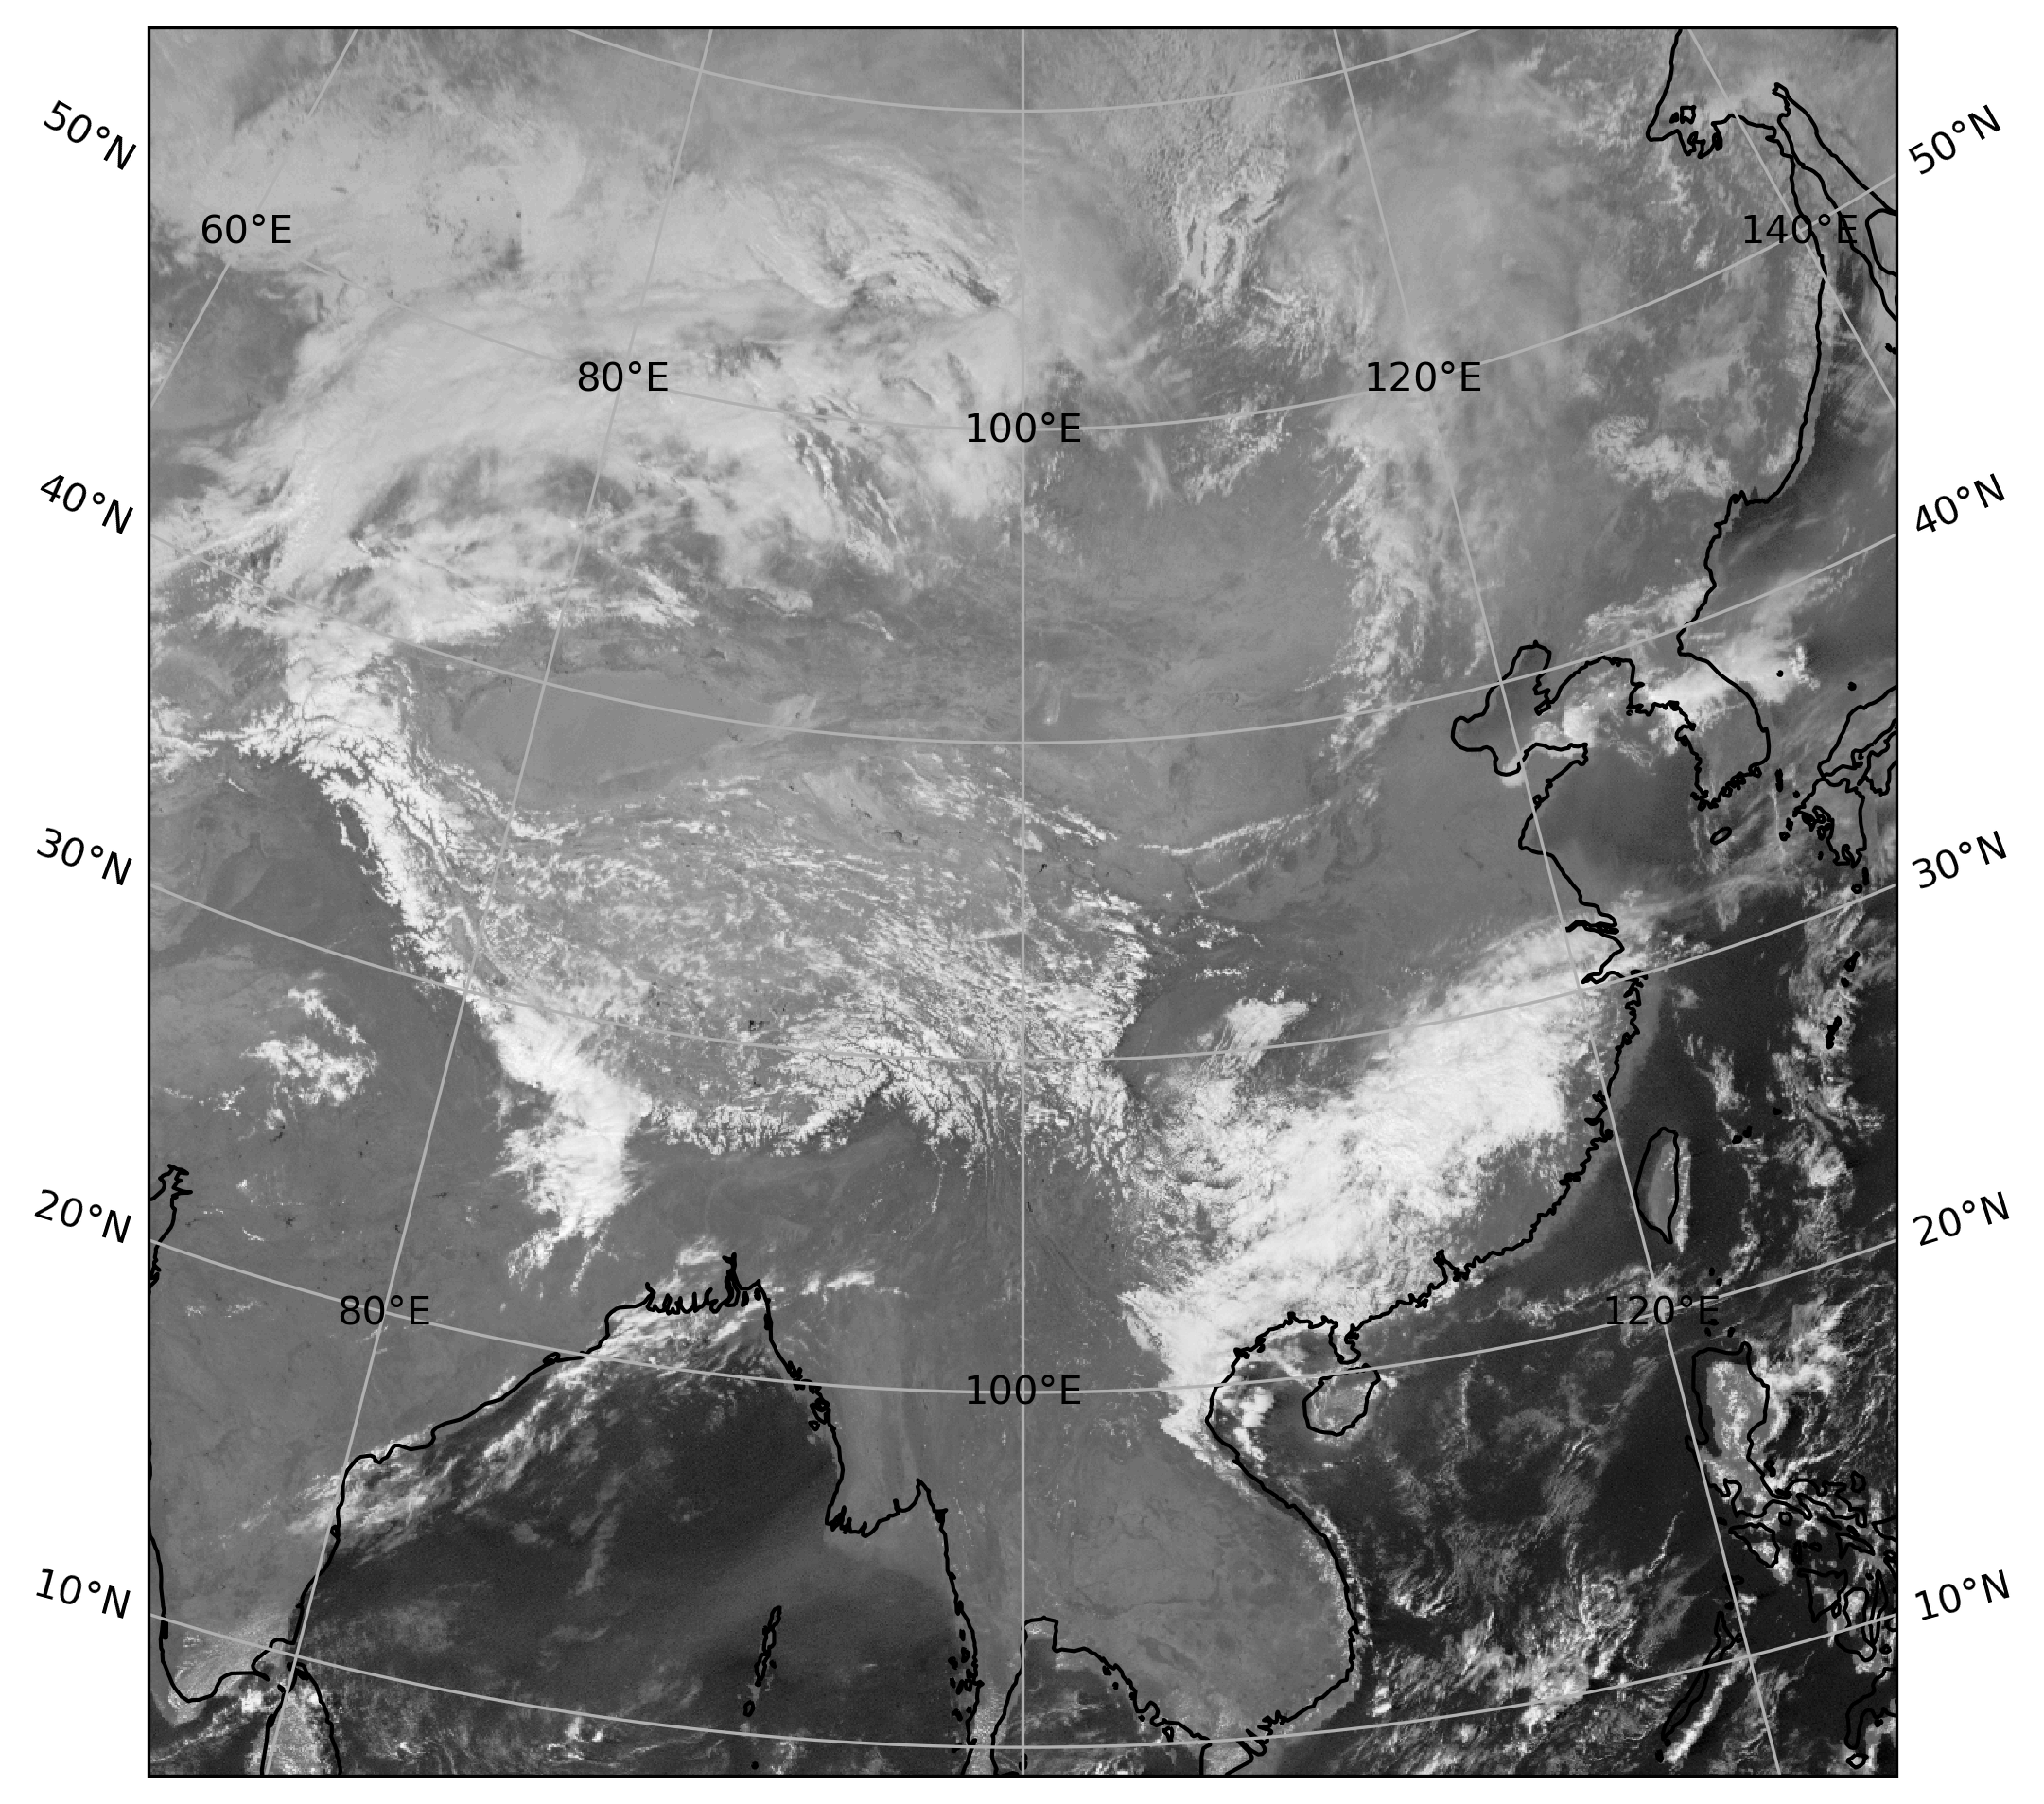
Print AWX file head information
Usage:
awx_info AWX_File_Name
Example:
awx_info FY2G_TBB_IR1_OTG_20150729_0000.AWX
Convert AWX file to netCDF4 file
Usage:
awx_to_nc AWX_File_Name NetCDF_File_Name
Example:
awx_to_nc FY2G_TBB_IR1_OTG_20150729_0000.AWX FY2G_TBB_IR1_OTG_20150729_0000.nc