Bartleby Related Questions Icon
Related questions
Question
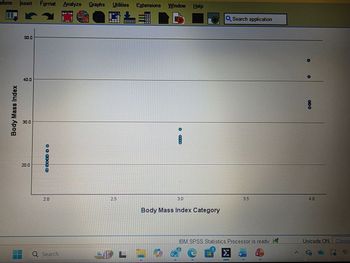
I need help with spss system. I am having to run bmi and bmi categories. Am I doing the scatterplot correctly? Why are my dots stacked? I can't edit the actual data. I can only run stuff from the data.
Transcribed Image Text:sform
Body Mass Index
Insert Format Analyze
Analyze Graphs
Graphs
Utilities
Utilities Extensions Window Help
50.0
40.0
30.0
20.0
00000 00
2.0
2.5
Q Search
L
3.0
CIDO ©
Body Mass Index Category
•
Q Search application
3.5
4.0
00
IBM SPSS Statistics Processor is ready
Unicode ON Classi
E
W
P
![画像:Graphs Utilities Extensions Window Help Simple Scatterplot X Y Axis: Titles... Subject Number... Body Mass Index [BMI] Gender [GEN] Options... X Axis: Age [AGE] Body Mass Index Category [B... Height (cm) [HT] Set Markers by: Body Type [BT] Weight (kg) [WT] Percentage of B... Fat Mass (kg) [... Fat Free Mass (. + Label Cases by: Muscle Mass (k... Panel by Total Body Wat... Rows: Total Body Wat... Bone Mass (kg)... Basal Metabolic... Metabolic Age [... Frame Size [FS] Nest variables (no empty rows) Columns: Wrist Circumfer... Elbow Frame Si... Wrist Frame Si... V Filter by: Nest variables (no empty columns) Template ☐ Use chart specifications from: File Ο L ASUS Vivobook Σ W P 000 > 4.0 icode ON Class](https://content.bartleby.com/qna-images/question/bd22b52a-6dfa-469c-bd54-cf7ab5928eb2/a2779690-1dfa-4522-a0b2-a9082eaa2da7/vbj6lmf_thumbnail.jpeg)
Transcribed Image Text:Graphs Utilities Extensions Window Help
Simple Scatterplot
X
Y Axis:
Titles...
Subject Number...
Body Mass Index [BMI]
Gender [GEN]
Options...
X Axis:
Age [AGE]
Body Mass Index Category [B...
Height (cm) [HT]
Set Markers by:
Body Type [BT]
Weight (kg) [WT]
Percentage of B...
Fat Mass (kg) [...
Fat Free Mass (.
+
Label Cases by:
Muscle Mass (k...
Panel by
Total Body Wat...
Rows:
Total Body Wat...
Bone Mass (kg)...
Basal Metabolic...
Metabolic Age [...
Frame Size [FS]
Nest variables (no empty rows)
Columns:
Wrist Circumfer...
Elbow Frame Si...
Wrist Frame Si... V
Filter by:
Nest variables (no empty columns)
Template
☐ Use chart specifications from:
File
Ο
L
ASUS Vivobook
Σ
W
P
000
>
4.0
icode ON Class
Expert Solution
Check MarkThis question has been solved!
Explore an expertly crafted, step-by-step solution for a thorough understanding of key concepts.
bartleby
Step by stepSolved in 2 steps