This site needs JavaScript to work properly. Please enable it to take advantage of the complete set of features!
Skip to main page content
U.S. flag

An official website of the United States government

Dot gov

The .gov means it’s official.
Federal government websites often end in .gov or .mil. Before sharing sensitive information, make sure you’re on a federal government site.

Https

The site is secure.
The https:// ensures that you are connecting to the official website and that any information you provide is encrypted and transmitted securely.

NIH NLM Logo
Log in
Access keys NCBI Homepage MyNCBI Homepage Main Content Main Navigation
. 2025 Jan 8;22(1):3.
doi: 10.1186/s12974-024-03330-1.

Infection with Toxoplasma gondii triggers coagulation at the blood-brain barrier and a reduction in cerebral blood flow

Affiliations

Infection with Toxoplasma gondii triggers coagulation at the blood-brain barrier and a reduction in cerebral blood flow

Evelyn M Hoover et al. J Neuroinflammation. .

Abstract

Background: Immunothrombosis is the process by which the coagulation cascade interacts with the innate immune system to control infection. However, the formation of clots within the brain vasculature can be detrimental to the host. Recent work has demonstrated that Toxoplasma gondii infects and lyses central nervous system (CNS) endothelial cells that form the blood-brain barrier (BBB). However, little is known about the effect of T. gondii infection on the BBB and the functional consequences of infection on cerebral blood flow (CBF) during the different stages of infection.

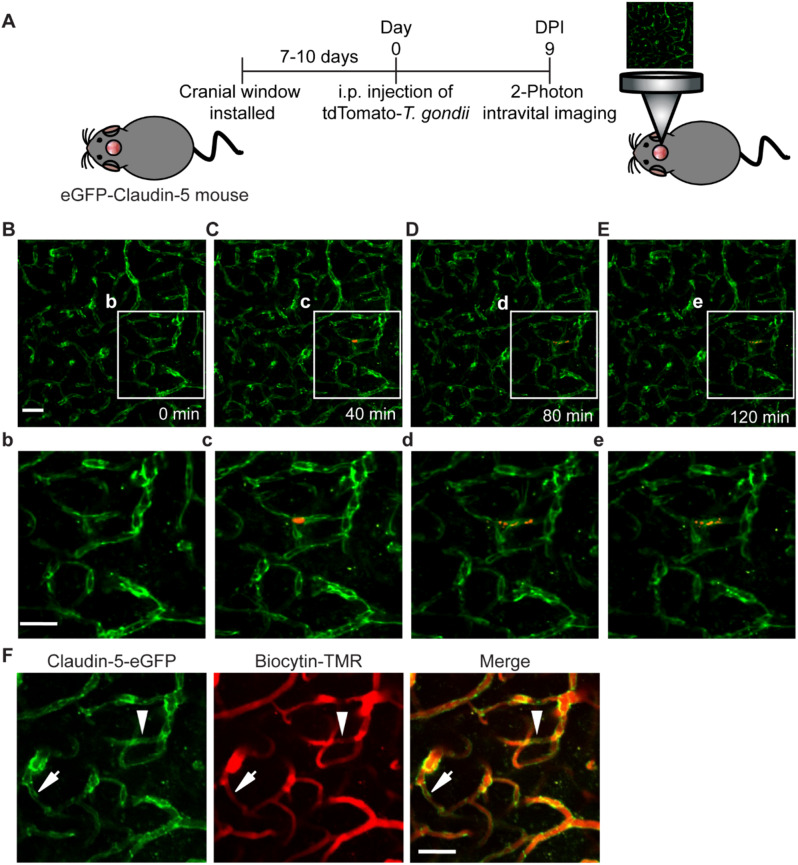
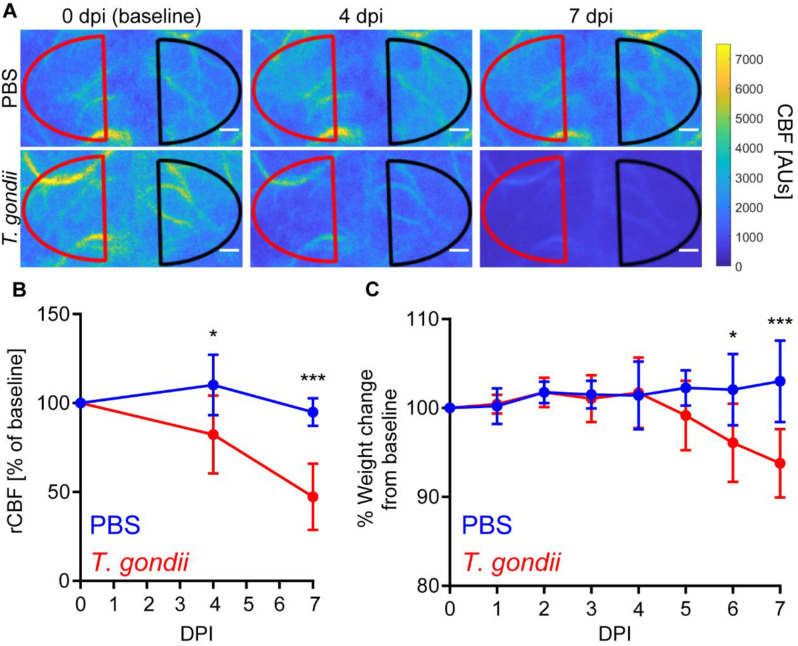
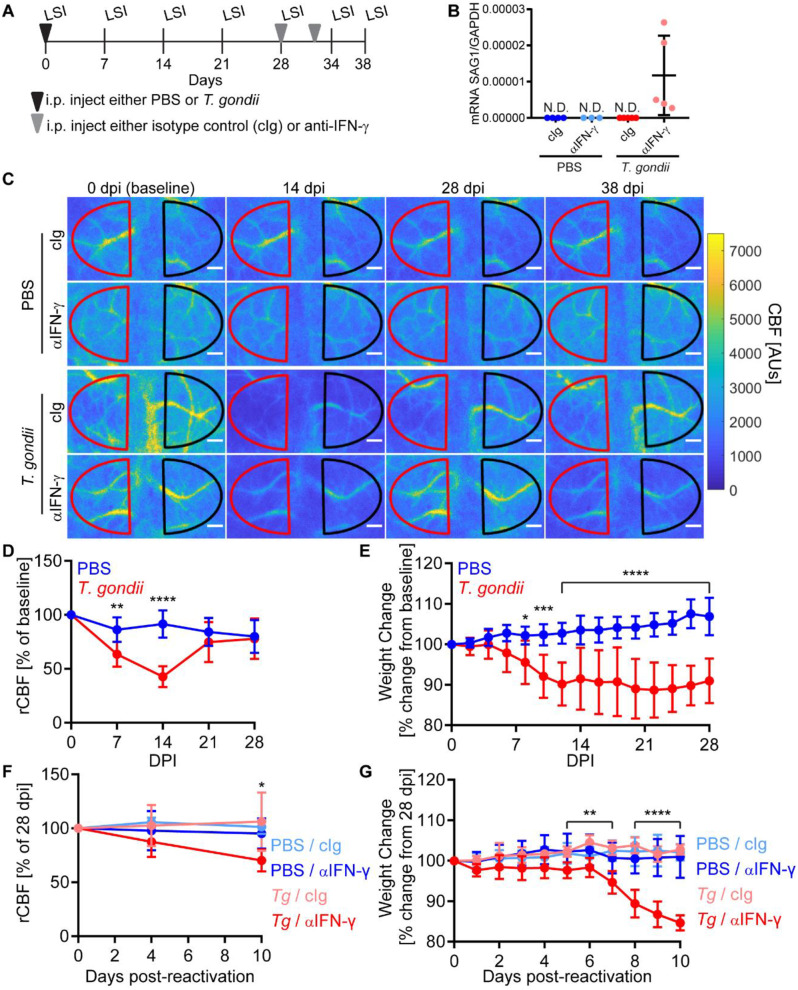
Main body: We demonstrate that brain endothelial cells upregulate the adhesion molecules ICAM-1 and VCAM-1 and become morphologically more tortuous during acute T. gondii infection of mice. Longitudinal two-photon imaging of cerebral blood vessels during infection in mice revealed vascular occlusion in the brain, prompting an analysis of the coagulation cascade. We detected platelet-fibrin clots within the cerebral vasculature during acute infection. Analysis of CBF using longitudinal laser-speckle imaging during T. gondii infection demonstrated that CBF decreased during acute infection, recovered during stable chronic infection, and decreased again during reactivation of the infection induced by IFN-γ depletion. Finally, we demonstrate that treatment of mice with a low-molecular-weight heparin, an anticoagulant, during infection partially rescued CBF in T. gondii-infected mice without affecting parasite burden.

Conclusions: Our data provide insight into the host-pathogen interactions of a CNS parasite within the brain vasculature and suggest that thrombosis and changes in cerebral hemodynamics may be an unappreciated aspect of infection with T. gondii.

Keywords: Toxoplasma gondii; Blood-brain barrier; CNS infection; Cerebral blood flow; Thrombosis.


Conflict of interest statement

Declarations. Ethics approval and consent to participate: All procedures and protocols were approved by the Institutional Animal Care and Use Committee (IACUC) at the University of California, Irvine. Consent for publication: All authors approved this manuscript and provided consent for publication. Competing interests: The authors declare no competing interests.

Figures

Fig. 1
Fig. 1
Endothelial cell activation in response to T. gondii infection. A) Representative confocal microscopy of brain sections from eGFP-Claudin-5 mice injected with PBS or T. gondii at 5, 7, and 8 days post-infection (dpi). Sections stained with Hoechst (blue) and imaged for eGFP-Claudin-5 (green), and T. gondii (red). Scale bars, 10 μm. B) Confocal microscopy of brain sections from PBS-injected or T. gondii-infected eGFP-Claudin-5 mice at 9 dpi. Scale bars, 15 μm. C) B1 qPCR of DNA extracted from brain homogenates to determine T. gondii per mg of brain tissue in mice injected with PBS or T. gondii (9 dpi). Each circle represents one mouse. D-E) Representative confocal images of brain sections stained with antibodies against GLUT1 and (D) ICAM-1 or (E) VCAM-1 in C57BL/6J mice injected with PBS or T. gondii at 7 dpi. Scale bars, 15 μm. F-G) Percent area of ICAM-1 or VCAM-1 in GLUT1+ vessels. Each circle represents one mouse. n = 5–6 mice per group. H-J) Intravital 2-photon imaging was performed through a cranial window on eGFP-Claudin-5 mice injected with PBS or T. gondii. Longitudinal imaging was performed at baseline (0 dpi) and at 6 dpi in both control and infected mice. H) Representative field of view showing blood vessels in the cortex at both timepoints. Numbers indicate the same endothelial cells across days. Open arrowheads represent protrusions that were detected at 6 dpi. Scale bars, 20 μm. I) Endothelial cell protrusions at day 0 and day 6. A minimum of 3 vessel sections were quantified for each mouse across at least 3 fields of view (n = 32–52 cells total per mouse). J) Representation of shape index: circle has the highest shape index, 1, and a more tortuous shape has lower shape index. K) Shape index of brain endothelial cells at day 0 and day 6. Arrowheads point out protrusions. Each dot represents a single endothelial cell. n = 150–255 cells per group from 3–4 independent mice per group. **P < 0.005, *** P < 0.001, ****P < 0.0001; Student’s t test (C, F-G), one-way ANOVA (I-J). All error bars represent SD
Fig. 2
Fig. 2
Reduced blood vessel perfusion during acute T. gondii infection. A) Schematic of experimental workflow for intravital 2-photon imaging in the cortex of an eGFP-Claudin-5 mouse infected with tdTomato-expressing T. gondii at 9 dpi. B-E) Imaging in the same field of view (FOV) at 0, 40, 80, and 120 min. b-e) Insets show a magnified FOV around the T. gondii vacuole. F) Biocytin-TMR (860 D) was injected i.v. during imaging and dye perfusion (red) was imaged in the same FOV as in B-E. Arrowhead shows the reduced dye perfusion adjacent to the T. gondii parasites. Arrow shows a location distal to the parasites with reduced perfusion. Scale bars, 50 μm
Fig. 3
Fig. 3
Evidence of platelet-fibrin clot formation in cerebral vessels of T. gondii-infected mice. C57BL/6J mice were infected with T. gondii or injected with PBS, and brains were harvested at 9 dpi. A) Confocal image of brain section stained with antibodies against GLUT1, CD41, and fibrin. Scale bars, 50 μm. B-C) Widefield images of brain sections stained with anti-GLUT1 and either anti-CD41 (B) or anti-fibrin (C). Scale bars, 50 μm. D) Percent area of GLUT1 within each FOV. E-F) Percent area of CD41 or fibrin in GLUT1+ vessels, respectively. Each circle represents one FOV. n = 40–80 FOVs from 4 independent mice per group. **** P < 0.0001; Student’s t test. Error bars represent SD
Fig. 4
Fig. 4
CBF changes during acute T. gondii infection. C57BL/6 mice were injected with PBS or infected with T. gondii and longitudinal laser speckle imaging was performed at 0, 4, and 7 dpi through the intact skull to measure CBF. A) Representative laser speckle images of control and T. gondii-infected mice. Scale bars, 400 μm. B) Percent change of rCBF to baseline in control and T. gondii-infected mice. C) Percent weight change from baseline in control and T. gondii-infected mice. n = 4–5 mice per group. *P < 0.05, ***P < 0.001; significance between mock and infected mice at each timepoint was calculated by a repeated measures two-way ANOVA, with a post hoc Sidak’s multiple comparisons test. Error bars represent SD
Fig. 5
Fig. 5
CBF changes during chronic T. gondii infection. A) Experimental set-up for chronic infection and reactivation laser speckle imaging (LSI) experiments. C57BL/6 mice were injected with PBS or infected with 200 type II T. gondii tachyzoites at 0 dpi after the first imaging session. Antibodies were injected at 28 and 32 dpi. B) Relative expression of SAG1 to GAPDH transcripts in brains of control (PBS) and T. gondii-infected mice at 38 dpi. Mice were administered control IgG (cIg) or anti-IFN-γ (αIFN-γ) starting at 28 dpi. SAG1 was not detected (ND) in any group except the T. gondii-infected mice given anti-IFN-γ. C) Representative laser speckle imaging showing CBF in control (PBS) or T. gondii-infected mice at 0, 14, 28, and 38 dpi. The red and black hemispheres show the ROIs for the right and left hemispheres. Scale bars, 400 μm. D) Percent change of rCBF to baseline in control and T. gondii-infected mice over time. E) Percent weight change from baseline in control and T. gondii-infected mice. (F) Percent change of rCBF in control and T. gondii-infected mice (Tg) administered cIg or anti-IFN-γ. (G) Percent weight change in control and T. gondii-infected mice administered cIg or anti-IFN-γ during reactivation. n = 8–11 mice (D-E) and 4–7 mice per group (F-G). *P < 0.05, **P < 0.005, ***P < 0.001, ****P < 0.0001; differences between groups at each timepoint were determined by a two-way ANOVA (D-E) or a mixed-effects analysis (F-G) with a post-hoc Sidak’s multiple comparisons test. In F-G, significance is shown between T. gondii-infected mice treated with IgG or anti-IFN-γ. Error bars represent SD
Fig. 6
Fig. 6
Nadroparin calcium treatment of T. gondii-infected mice. A) Representative Western blot of fibrin and β-actin from livers of mock- and T. gondii-infected mice treated with PBS or Nadroparin at 7 dpi. B) Quantification of fibrin in mock-treated mice given PBS or nadroparin and T. gondii-infected mice given PBS or nadroparin. n = 1–3 mice per group. * P < 0.05; significance was calculated by one-way ANOVA followed by a Tukey post-test. C) Percent change of rCBF to baseline in T. gondii-infected mice treated with PBS or nadroparin calcium at 0, 4, and 7 dpi. D) Percent weight change from baseline in T. gondii-infected mice treated with PBS or nadroparin calcium. n = 3–6 mice per group. *P < 0.05, **P < 0.005, ns = not significant; significance was calculated by a mixed-effects analysis with a post hoc Sidak’s multiple comparisons test. Brain (E) and liver (F) homogenates were examined for the T. gondii B1 gene by qPCR to determine T. gondii per mg of tissue in T. gondii-infected mice treated with PBS or nadroparin (7 dpi). G) IFN-γ levels were quantified with an ELISA in T. gondii-infected mice treated with PBS or nadroparin (7dpi). n = 3 mice per group. Significance was calculated with a Student’s t test. Error bars represent SD
Fig. 7
Fig. 7
Model of changes to the brain microvasculature during T. gondii infection. On the left is the brain microvasculature of an uninfected mouse, with no upregulation of adhesion molecules, and no changes to tortuosity. On the right, we demonstrate that in the brain microvasculature of T. gondii-infected mice there is increased tortuosity and adhesion molecules (VCAM-1 and ICAM-1), as well as increased coagulation, resulting in decreased cerebral blood flow (created using Biorender)

References

    1. Mackman N, Tilley RE, Key NS. Role of the extrinsic pathway of blood coagulation in hemostasis and thrombosis. Arterioscler Thromb Vasc Biol [Internet]. 2007;27:1687–93. Available from: 10.1161/ATVBAHA.107.141911 - PubMed
    1. Eddleston M, de la Torre JC, Oldstone MB, Loskutoff DJ, Edgington TS, Mackman N. Astrocytes are the primary source of tissue factor in the murine central nervous system. A role for astrocytes in cerebral hemostasis. J Clin Invest [Internet]. 1993;92:349–58. Available from: 10.1172/JCI116573 - PMC - PubMed
    1. Brühl M, Stark K, Steinhart A, Chandraratne S, Konrad I, Lorenz M et al. Monocytes, neutrophils, and platelets cooperate to initiate and propagate venous thrombosis in mice in vivo. J Exp Med [Internet]. 2012;209:819–35. Available from: http://www.jem.org/lookup/doi/10.1084/jem.20112322 - PMC - PubMed
    1. Massberg S, Grahl L, Von Bruehl ML, Manukyan D, Pfeiler S, Goosmann C et al. Reciprocal coupling of coagulation and innate immunity via neutrophil serine proteases. Nat Med [Internet]. 2010;16:887–96. Available from: 10.1038/nm.2184 - PubMed
    1. Maugeri N, Brambilla M, Camera M, Carbone A, Tremoli E, Donati MB et al. Human polymorphonuclear leukocytes produce and express functional tissue factor upon stimulation. J Thromb Haemost [Internet]. 2006;4:1323–30. Available from: http://onlinelibrary.wiley.com/doi/10.1111/j.1538-7836.2006.01968.x/full - PubMed

Substances

Cite

AltStyle によって変換されたページ (->オリジナル) /