This site needs JavaScript to work properly. Please enable it to take advantage of the complete set of features!
Skip to main page content
U.S. flag

An official website of the United States government

Dot gov

The .gov means it’s official.
Federal government websites often end in .gov or .mil. Before sharing sensitive information, make sure you’re on a federal government site.

Https

The site is secure.
The https:// ensures that you are connecting to the official website and that any information you provide is encrypted and transmitted securely.

NIH NLM Logo
Log in
Access keys NCBI Homepage MyNCBI Homepage Main Content Main Navigation
. 2024 Oct 16;15(10):e0214024.
doi: 10.1128/mbio.02140-24. Epub 2024 Aug 29.

Hypermigration of macrophages through the concerted action of GRA effectors on NF-κB/p38 signaling and host chromatin accessibility potentiates Toxoplasma dissemination

Affiliations

Hypermigration of macrophages through the concerted action of GRA effectors on NF-κB/p38 signaling and host chromatin accessibility potentiates Toxoplasma dissemination

Arne L Ten Hoeve et al. mBio. .

Abstract

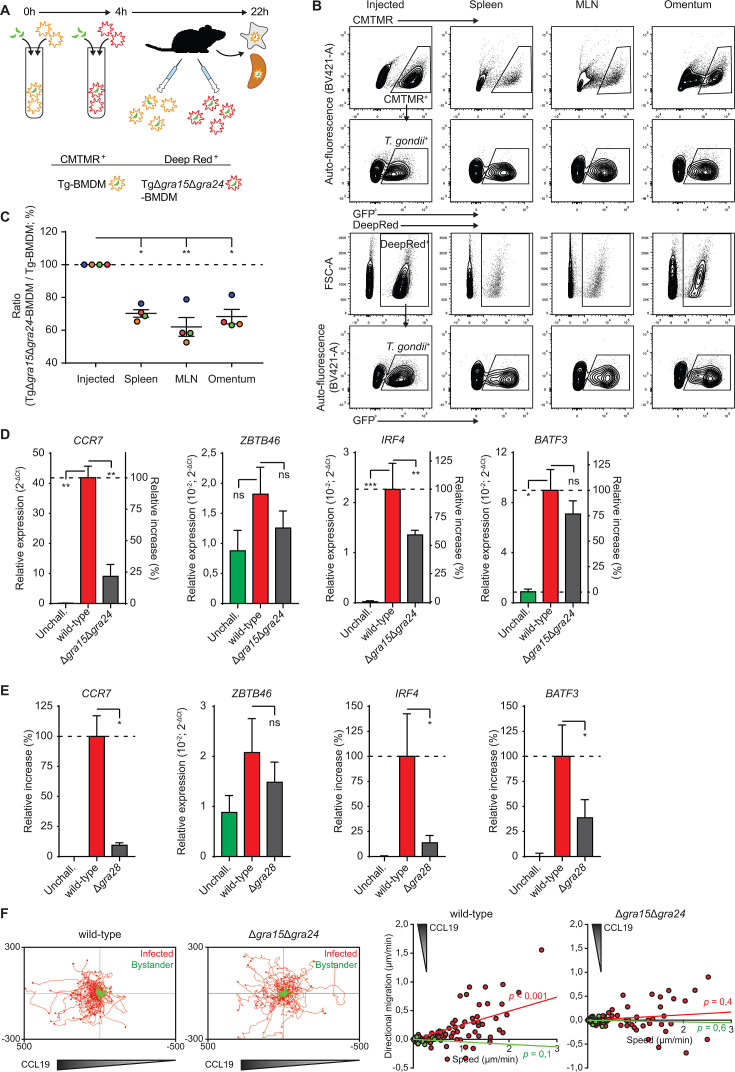
Mononuclear phagocytes facilitate the dissemination of the obligate intracellular parasite Toxoplasma gondii. Here, we report how a set of secreted parasite effector proteins from dense granule organelles (GRA) orchestrates dendritic cell-like chemotactic and pro-inflammatory activation of parasitized macrophages. These effects enabled efficient dissemination of the type II T. gondii lineage, a highly prevalent genotype in humans. We identify novel functions for effectors GRA15 and GRA24 in promoting CCR7-mediated macrophage chemotaxis by acting on NF-κB and p38 mitogen-activated protein kinase signaling pathways, respectively, with contributions by GRA16/18 and counter-regulation by effector TEEGR. Furthermore, GRA28 boosted chromatin accessibility and GRA15/24/NF-κB-dependent transcription at the Ccr7 gene locus in primary macrophages. In vivo, adoptively transferred macrophages infected with wild-type T. gondii outcompeted macrophages infected with a GRA15/24 double mutant in migrating to secondary organs in mice. The data show that T. gondii, rather than being passively shuttled, actively promotes its dissemination by inducing a finely regulated pro-migratory state in parasitized human and murine phagocytes via co-operating polymorphic GRA effectors.

Importance: Intracellular pathogens can hijack the cellular functions of infected host cells to their advantage, for example, for intracellular survival and dissemination. However, how microbes orchestrate the hijacking of complex cellular processes, such as host cell migration, remains poorly understood. As such, the common parasite Toxoplasma gondii actively invades the immune cells of humans and other vertebrates and modifies their migratory properties. Here, we show that the concerted action of a number of secreted effector proteins from the parasite, principally GRA15 and GRA24, acts on host cell signaling pathways to activate chemotaxis. Furthermore, the protein effector GRA28 selectively acted on chromatin accessibility in the host cell nucleus to selectively boost host gene expression. The joint activities of GRA effectors culminated in pro-migratory signaling within the infected phagocyte. We provide a molecular framework delineating how T. gondii can orchestrate a complex biological phenotype, such as the migratory activation of phagocytes to boost dissemination.

Keywords: cell signaling pathway; host-pathogen; immune cell migration; intracellular parasitism; mononuclear phagocyte.


Conflict of interest statement

The authors declare no conflict of interest.

Figures

Fig 1
Fig 1
Phenotypes T. gondii-infected macrophages upon GRA15-deficiency and NF-κB inhibition. (A) The representative micrograph shows primary BMDMs stained for F-actin (phalloidin Alexa Fluor 594, white) and nuclei (DAPI, blue). Arrows indicate two intracellular vacuoles with replicating GFP-expressing type II T. gondii tachyzoites (green) 18 h post-challenge. Lower bystander cell is uninfected. Scale bar = 10 μm. (B) Quantitative PCR (qPCR) analysis of Ccr7 cDNA from BMDMs challenged for 18 h with freshly egressed T. gondii type II wild-type and GRA15-deficient (Δgra15) tachyzoites [PRU; Multiplicity of infection (MOI) 2]. For reference, macrophages were incubated in complete medium, unchallenged (unchall.). Displayed are relative expression (2−ΔCt) and the increase in expression relative to wild type (100%) and unchallenged (0%) conditions (mean + SEM; n = 4 independent experiments). (C) Motility plots depict the displacement of BMDMs challenged with freshly egressed T. gondii type II wild-type and GRA15-deficient (Δgra15) tachyzoites (PRU; MOI 1) over 14 h in a collagen matrix with a CCL19 gradient as detailed in Materials and methods (scale indicates μm; n = 3). For each condition, directional migration (μm/min) toward the CCL19 source and speed (μm/min) of individual cells is displayed in graphs, with linear regression lines. Infected cells (GFP+, red) and non-infected bystander cells (GFP, green) were analyzed. For each condition, P-values indicate the directional migration compared to hypothetical zero directionality (one-sample permutation test). (D) Flow cytometric analysis of anti-CD86 staining on BMDMs challenged for 18 h with freshly egressed GFP-expressing T. gondii type II wild-type (WT) and GRA15-deficient (Δgra15) tachyzoites (PRU; MOI 1) or left unchallenged. Infected (GFP+) and bystander cells (GFP) were analyzed. The bar graph displays the Mean fluorescence intensity (MFI) and the increase in expression relative to wild-type (100%) and unchallenged (0%) conditions (mean + SEM; n = 5). (E and F) qPCR analyses of Il12p40 (E) or Zbtb46, Irf4, and Nr4a3 (F) cDNA from BMDMs challenged and displayed as in (B), n = 4. (G) qPCR analyses of Ccr7, Il12p40, Zbtb46, and Irf4 cDNA from resident peritoneal macrophages (PEMs) challenged and displayed as in (B), n = 3. (H) qPCR analyses of Ccr7, Il12p40, Zbtb46, and Irf4 cDNA from BMDMs challenged for 18 h with GFP-expressing T. gondii type II wild-type tachyzoites with or without JSH-23 treatment (NFκBi). Displayed is the increase in expression relative to untreated unchallenged (0%) and wild-type (100%) challenged conditions (mean + SEM; n = 3). (I) Western blot analysis of phospho-IκBα ser32/36 (p-IκB) levels in BMDMs challenged for 5 h with freshly egressed T. gondii type II wild-type or GRA15-deficient (Δgra15) tachyzoites (PRU, MOI 3) or LPS (10 ng/mL) or left unchallenged (unchall.). The bar graph displays the relative density of specific p-IκB signal relative to specific GAPDH signal (mean + SEM; n = 3). Statistical comparisons were made with ANOVA and Dunnett’s post-hoc (B and D–I) or one-sample permutation tests (B; *P ≤ 0.05, **P ≤ 0.01, ***P ≤ 0.001, and ns P > 0.05).
Fig 2
Fig 2
Phenotypes of T. gondii-infected macrophages upon MYR1 and GRA24 deficiency. (A) Quantitative PCR (qPCR) analyses of Ccr7, Il12p40, Zbtb46, Nr4a3, Irf4, and Batf3 cDNA from BMDMs challenged for 18 h with freshly egressed T. gondii type II wild-type and MYR1-deficient (Δmyr1) tachyzoites (PRU; MOI 2) or left unchallenged (unchall.). Bar graphs display the increase in expression relative to untreated unchallenged (0%) and wild-type (100%) challenged conditions (mean + SEM; n = 4). (B) qPCR analysis of Ccr7 cDNA from BMDMs challenged for 18 h with T. gondii type II wild-type, GRA24-deficient (Δgra24), or GRA24-reconstituted (Δgra24 + GRA24) tachyzoites (PRU; MOI 2) or left unchallenged (unchall.), displayed as in (A), n = 3. (C) Motility plots depict the displacement of BMDMs challenged with freshly egressed T. gondii type II wild-type and GRA24-deficient (Δgra24) tachyzoites (PRU; MOI 1) over 14 h in a collagen matrix with a CCL19 gradient as detailed in Materials and methods (scale indicates μm; n = 3). For each condition, directional migration (μm/min) toward the CCL19 source and speed (μm/min) of individual cells is displayed in graphs, with linear regression lines. Infected cells (GFP+, red) and non-infected bystander cells (GFP, green) were analyzed. For each condition, P-values indicate the directional migration compared to hypothetical zero directionality (one-sample permutation test). (D) qPCR analyses of Il12p40, Zbtb46, Irf4, Batf3, and Nr4a3 of BMDMs challenged and displayed as in (B). (E) Western blot analysis of p-p38 (Thr180/Tyr182) expression in cytoplasm- and nucleus-enriched fractions of BMDMs challenged for 5 h with wild-type and GRA24-deficient (Δgra24) T. gondii type II tachyzoites (PRU, MOI 3). Bar graphs display the relative density of p-p38 signal relative to TATA-binding protein (TBP) or GAPDH signals (mean + SEM; n = 5). Statistical comparisons were made with ANOVA and Dunnett’s post-hoc tests (*P ≤ 0.05, **P ≤ 0.01, ***P ≤ 0.001, and ns P > 0.05).
Fig 3
Fig 3
Migratory activation in T. gondii-infected macrophages involves MAPK-associated kinases. (A and B) Quantitative PCR (qPCR) analyses of Ccr7, Il12p40, Zbtb46, and Irf4 cDNA from BMDMs challenged for 18 h with GFP-expressing T. gondii type II wild-type tachyzoites with (A) Trametinib (MEK1/2i), BIRB 796 (p38i), or JNK-IN-8 (JNKi) treatments, or (B) BIX02189 (MEK5i) treatment. Displayed is the increase in expression relative to untreated unchallenged (unchall., 0%) and wild-type (100%) challenged conditions [mean + SEM, n = 4 (A) and (B)]. (C and D) qPCR analyses of Ccr7, Il12p40, Zbtb46, and Irf4 cDNA from BMDMs challenged for 18 h with GFP-expressing T. gondii type II wild-type tachyzoites with or without BRD7389 (RSKi; C) or MK2-IN-1 (MK2i; D) treatment. Displayed as in (A), n = 4 (C) or 3 (D). (E) Flow cytometric analysis of anti-CD86 and MHCII staining on BMDMs challenged for 18 h with freshly egressed GFP-expressing T. gondii type II wild-type tachyzoites (PRU; MOI 1), with or without MK2-IN-1 (MK2i) treatment, or left unchallenged. Infected (GFP+) cells were analyzed for challenged conditions. The bar graph displays the increase in expression, as in (A), n = 4. (F) Western blot analysis of p-RSK (S380/386) expression in lysates of BMDMs challenged for 5 h with wild-type T. gondii type II tachyzoites (PRU, MOI 3) in the presence of indicated inhibitors. Representative of two experiments. Statistical comparisons were made with ANOVA and Dunnett’s post-hoc tests (A), paired t test (C–E), and Spearman correlation (B; *P ≤ 0.05, **P ≤ 0.01, ***P ≤ 0.001, and ns P > 0.05).
Fig 4
Fig 4
Effects of GRA15/24 double deficiency, NF-κB/p38 MAK inhibition, and canonical NF-κB signaling on the activation of T. gondii-infected macrophages (A), (B), and (C) quantitative PCR (qPCR) analyses of (A) Ccr7, Il12p40, Zbtb46, Irf4, (B) Nr4a3, Batf3, and (C) Egr1 cDNA from BMDMs challenged with T. gondii type II PRU (wild-type), GRA15 (Δgra15), GRA24 (Δgra24), or GRA15/24 double mutant (Δgra15Δgra24) tachyzoites (18 h, MOI 2). Displayed is the increase in expression relative to untreated unchallenged (unchall., 0%) and wild-type (100%) challenged conditions (mean + SEM, n = 4). (D) qPCR analyses of Ccr7, Il12p40, Zbtb46, and Irf4 cDNA from BMDMs challenged for 18 h with T. gondii type II wild-type tachyzoites in the presence of NFκB inhibitor (JSH-23 and NFκBi), p38 inhibitor (BIRB 796 and p38i), or combined treatment. Displayed is the increase in expression relative to untreated unchallenged (0%) and wild-type (100%) challenged conditions (mean + SEM; n = 3). (E) Western blot analysis of p-p38 (Thr180/Tyr182) expression in nucleus- and cytoplasm-enriched fractions of BMDMs challenged with PRU (wild-type), Δgra24, or Δgra24 tachyzoites (5 h, MOI 3). Bar graphs display the relative density of p-p38 signal relative to TATA-binding protein (TBP) or GAPDH signals (mean + SEM; n = 4). (F) qPCR analyses of Ccr7, Il12p40, Zbtb46, and Irf4 cDNA from wild-type BMDMs (WT) or Myd88−/− Ticam−/− Mavs−/− BMDMs triple knock out (TKO) challenged for 18 h with T. gondii type II wild-type tachyzoites (MOI 2). Displayed is the increase in expression relative to wild-type (100%; mean + SEM; n = 3). Statistical comparisons were made with ANOVA and Dunnett’s post-hoc tests (*P ≤ 0.05, **P ≤ 0.01, ***P ≤ 0.001, and ns P > 0.05).
Fig 5
Fig 5
Chromatin accessibility and phenotypes of macrophages challenged with wild-type and GRA28-deficient T. gondii tachyzoites. (A) Venn diagram shows numbers of identified ATAC-seq peaks in unchallenged BMDMs and BMDMs challenged for 18 h with T. gondii type II wild-type or GRA28-deficient (Δgra28) tachyzoites (PRU; MOI 2). (B) Genome tracks show ATAC-seq peak intensities, normalized to uniquely aligned reads (y-axis), around the promoter of Ccr7 gene. For BMDMs, ATAC-seq signal is from two separate biological replicates per condition. Upper tracks show peak signals from dendritic cells (cDC1) and peritoneal cavity macrophages (MΦ PC) extracted from ImmGen publicly available data set. Red outline indicates the region of interest near the transcription start site (TSS). (C) Upper bar graph shows Ccr7 expression by cDC1 and MΦ PC, quantified by RNA-seq (ImmGen publicly available data set). Lower bar graph shows qPCR analysis of Ccr7 cDNA from BMDMs challenged for 18 h with T. gondii type II wild-type or GRA28-deficient (Δgra28) tachyzoites (PRU; MOI 2) or left unchallenged. The increase in expression relative to unchallenged (unchall., 0%) and wild-type (100%) challenged conditions is displayed (mean + SEM, n = 5). (D) Motility plots depict the displacement of BMDMs challenged with CMTMR-stained T. gondii type II wild-type and GRA28-deficient (Δgra28) tachyzoites (PRU; MOI 1) in a CCL19 gradient, as detailed in Materials and methods (scale indicates μm). For each condition, directional migration (μm/min) toward the CCL19 source and speed (μm/min) of individual cells is displayed in graphs, with linear regression lines. Infected cells (CMTMR+) were analyzed from three independent experiments. For each condition, P-values indicate the directional migration compared to hypothetical zero directionality (one-sample permutation test). (E–I) ATAC-seq genome tracks for (E) Il12p40, (F) Ccl22, (G) Zbtb46, (H) Irf4, and (I) CD86 in cDC1 and MΦ PC as in (B) and transcriptional analyses as in (C). (J) Flow cytometric analysis of anti-CD86 staining on BMDMs challenged for 18 h with CFSE-stained T. gondii type II wild-type tachyzoites (PRU; MOI 1). Infected (CFSE+) cells were analyzed for challenged conditions. The bar graph displays expression related to wild type (mean + SEM, n = 4). Statistical comparisons were made with ANOVA and Dunnett’s post-hoc tests (C, E, G, H, J, *P ≤ 0.05, **P ≤ 0.01, **P ≤ 0.001, and ns P > 0.05).
Fig 6
Fig 6
Impact of GRA15/24 on T. gondii dissemination in mice and on the phenotypes of human macrophages and monocytes. (A) Illustration of experimental setup and conditions for co-adoptive transfers of BMDMs challenged with T. gondii (PRU) wild-type (Tg-BMDM) or GRA15/24 double mutant (TgΔgra15Δgra24-BMDM) and pre-labeled with CMTMR or CellTracker Deep Red dyes, respectively. (B) Contour plots show a typical gating strategy for flow cytometric detection of pre-labeled and T. gondii parasitized BMDMs (CMTMR+/Deep red+ and GFP+) as injected intraperitoneally and extracted from spleen, MLN, and omentum 18 h post-inoculation, as detailed under Materials and methods. Single (CD11c+) BMDMs were pre-gated as shown in Fig. S8A. (C) Flow cytometric analysis of wild-type- or Δgra15Δgra24-challenged BMDMs in the spleen, MLNs, and omentum 18 h post-inoculation. Data are presented as the change in ratio between detected challenged Deep red+GFP+gra15Δgra24) cells and CMTMR+GFP+ (wild-type) cells related to the inoculated ratio (normalized to 100%). Mean ratio change ±SE and individual mice (n = 4) are displayed. (D and E) qPCR analyses of Ccr7, Il12p40, Zbtb46, and Irf4 cDNA from human monocyte-derived macrophages (mo-macs) challenged with T. gondii type II PRU (wild type), (D) Δgra15Δgra24, or (E) Δgra28 tachyzoites (18 h, MOI 2). Displayed is a relative expression (2−ΔCt) or the relative and increase in expression relative to untreated unchallenged (unchall., 0%) and wild-type (100%) challenged conditions (mean + SEM, n = 4). (F) Motility plots depict the displacement of mo-macs challenged with wild-type and Δgra15Δgra24 tachyzoites (14 h MOI 1) in a CCL19 gradient as detailed in Materials and methods (scale indicates μm; n = 3). For each condition, directional migration (μm/min) toward the CCL19 source and speed (μm/min) of individual cells is displayed in graphs, with linear regression lines. Infected cells (GFP+, red) were analyzed. For each condition, P-values indicate the directional migration compared to hypothetical zero directionality (one-sample permutation test). Statistical comparisons were made with weighted least square and Dunnett’s post-hoc tests (C) or ANOVA and Dunnett’s post-hoc tests (D, E *P ≤ 0.05, **P ≤ 0.01, **P ≤ 0.001, and ns P > 0.05).
Fig 7
Fig 7
Hypothetical model for the migratory activation of parasitized macrophages by Toxoplasma. (1) T. gondii actively invades the macrophage and forms a PV where it replicates and secretes effector proteins from secretory organelles (dense granules) into the host cell cytosol via the MYR1 translocon. (2) The effector GRA28 is secreted into the host cell cytosol MYR1 dependently and locates to the nucleus where it complexes with chromatin remodelers (SWI/SNF) to open up chromatin. (3) GRA15 is secreted MYR1 independently and interacts with TRAF6 to activate NF-κB, which locates to the nucleus. In parasitized macrophages, NF-κB activation occurs independently of TLR/MyD88/TRIF/MAVS signaling. (4) MYR1-dependent secretion of GRA24 activates p38 signaling and potentiates NF-κB activation via RSK and MK-2. RSK is also regulated via RAS-ERK MAPK pathway, which becomes activated via CaMK upon T. gondii infection (16). The GRA24/p38 complex can also travel to the nucleus. (5) GRA28-mediated increased chromatin accessibility facilitate GRA15/24/p38-driven transcription via NF-κB at the Ccr7, Il12, and Cd86 gene loci. (6) GRA16 and GRA18 contribute to macrophage activation by unknown mechanisms. In contrast, the effector TEEGR counteracts activation, presumably through interaction with the transcriptional repressor EZH2. The elevated transcription of DC-related transcription factors (Zbtb46, Irf4, Nr4a3, and Batf3) also drives expression of Ccr7, Il12, and Cd86. (7) Altered signaling results in elevated expression of CCR7 with chemotactic responses, pro-inflammatory IL-12, and CD86 expression. Color-coded hexagonal shapes represent parasite effectors, and oval shapes represent corresponding host effectors and signaling pathways. Dashed lines represent hypothetical signaling or signaling not addressed here.

Update of

References

    1. Epelman S, Lavine KJ, Randolph GJ. 2014. Origin and functions of tissue macrophages. Immunity 41:21–35. doi:10.1016/j.immuni.2014年06月01日3 - DOI - PMC - PubMed
    1. Bosurgi L, Cao YG, Cabeza-Cabrerizo M, Tucci A, Hughes LD, Kong Y, Weinstein JS, Licona-Limon P, Schmid ET, Pelorosso F, Gagliani N, Craft JE, Flavell RA, Ghosh S, Rothlin CV. 2017. Macrophage function in tissue repair and remodeling requires IL-4 or IL-13 with apoptotic cells. Science 356:1072–1076. doi:10.1126/science.aai8132 - DOI - PMC - PubMed
    1. Price JV, Vance RE. 2014. The macrophage paradox. Immunity 41:685–693. doi:10.1016/j.immuni.2014年10月01日5 - DOI - PubMed
    1. Frickel EM, Hunter CA. 2021. Lessons from Toxoplasma: host responses that mediate parasite control and the microbial effectors that subvert them. J Exp Med 218:e20201314. doi:10.1084/jem.20201314 - DOI - PMC - PubMed
    1. Miller JC, Brown BD, Shay T, Gautier EL, Jojic V, Cohain A, Pandey G, Leboeuf M, Elpek KG, Helft J, Hashimoto D, Chow A, Price J, Greter M, Bogunovic M, Bellemare-Pelletier A, Frenette PS, Randolph GJ, Turley SJ, Merad M, Immunological Genome Consortium . 2012. Deciphering the transcriptional network of the dendritic cell lineage. Nat Immunol 13:888–899. doi:10.1038/ni.2370 - DOI - PMC - PubMed

MeSH terms

Cite

AltStyle によって変換されたページ (->オリジナル) /