Spatiotemporal patterns of rabid dogs and cats and the opinions of personnel responsible for disease control in Thailand
- PMID: 38027942
- PMCID: PMC10658336
- DOI: 10.1016/j.heliyon.2023.e21969
Spatiotemporal patterns of rabid dogs and cats and the opinions of personnel responsible for disease control in Thailand
Abstract
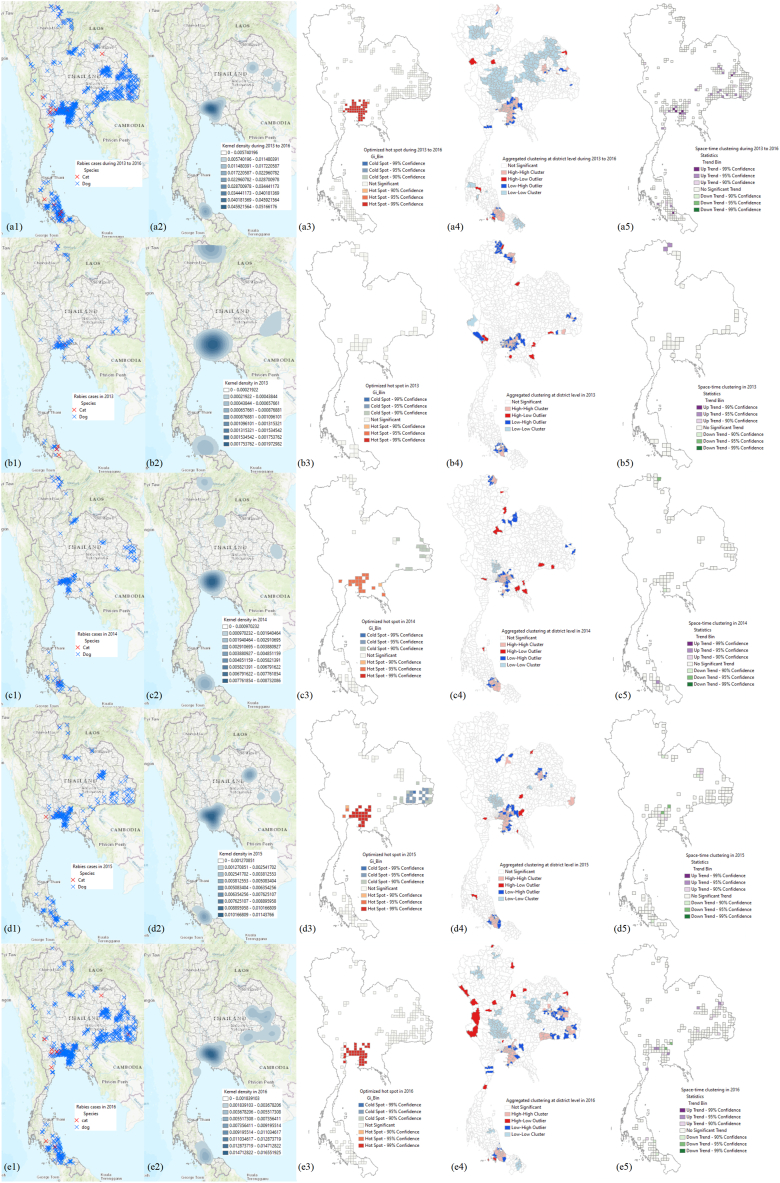
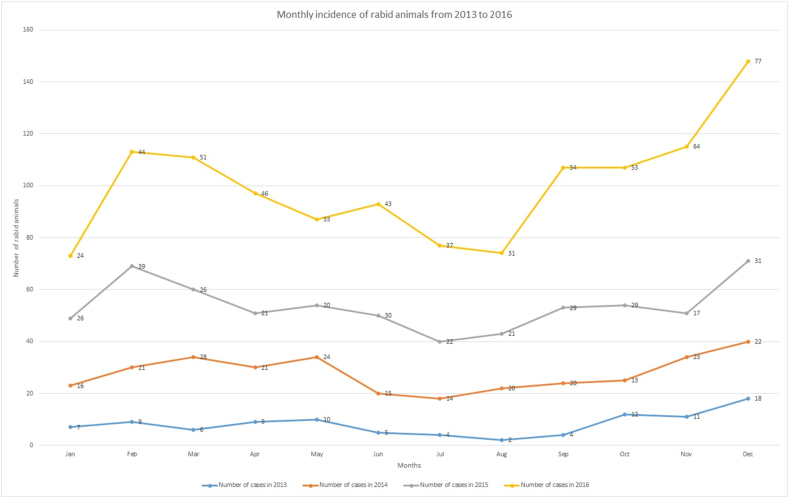
The aim of this study was to evaluate the patterns of rabies cases in dogs and cats in Thailand from 2013 to 2016 via spatiotemporal analysis. We also assessed the opinions of responsible district-level personnel regarding risk factors and control measures for rabies. Evaluation of rabies case patterns was based on secondary data from a national online database, and a structured questionnaire was used to obtain the opinions of district-level personnel. A total of 1202 cases (1202/13058, 9.21 %) of rabid dogs and cats were documented between 2013 and 2016, with the majority of cases involving dogs (1165/13058; 8.92 %). The spatiotemporal analysis indicated that most of the cases were recorded in central Thailand and that there was a general trend of an increase in rabies cases from the beginning of 2013 to the end of 2016. Month-by-month analysis for each year suggested that the number of rabies cases tended to increase over the course of the year in 2013 and 2016. Results from the autocorrelation indicated that the correlation coefficient tended to be similar in adjacent time lags. In terms of the opinion analysis, only one factor (i.e., the presence of a forest that served as a habitat for carrier animals in the district) was statistically significant (P < 0.05) in the final binary logistic regression model. The results of this study may facilitate planning for effective rabies control in Thailand.
Keywords: Rabies; Risk factor; Spatiotemporal patterns; Thailand.
© 2023 The Authors.
Conflict of interest statement
The authors declare that they have no known competing financial interests or personal relationships that could have appeared to influence the work reported in this paper.
Figures
References
-
- Puanghat A., Hunsoowan V. Rabies situation in Thailand. J. Med. Assoc. Thai. 2005;88:1319–1322. - PubMed
-
- Bureau of Epidemiology . Thailand; 2016. Weekly Epidemiological Surveillance Report Rabies Situation in Humans and Animals; pp. 327–343. 2015, 2558 ed.
-
- Thai Rabies Net . 2017. Information System for Rabies Surveillance.http://www.thairabies.net/trn/
LinkOut - more resources
Full Text Sources
Miscellaneous