This site needs JavaScript to work properly. Please enable it to take advantage of the complete set of features!
Skip to main page content
U.S. flag

An official website of the United States government

Dot gov

The .gov means it’s official.
Federal government websites often end in .gov or .mil. Before sharing sensitive information, make sure you’re on a federal government site.

Https

The site is secure.
The https:// ensures that you are connecting to the official website and that any information you provide is encrypted and transmitted securely.

NIH NLM Logo
Log in
Access keys NCBI Homepage MyNCBI Homepage Main Content Main Navigation
. 2022 Aug 15;18(8):e1010321.
doi: 10.1371/journal.ppat.1010321. eCollection 2022 Aug.

An in vitro method for inducing titan cells reveals novel features of yeast-to-titan switching in the human fungal pathogen Cryptococcus gattii

Affiliations

An in vitro method for inducing titan cells reveals novel features of yeast-to-titan switching in the human fungal pathogen Cryptococcus gattii

Lamin Saidykhan et al. PLoS Pathog. .

Erratum in

Abstract

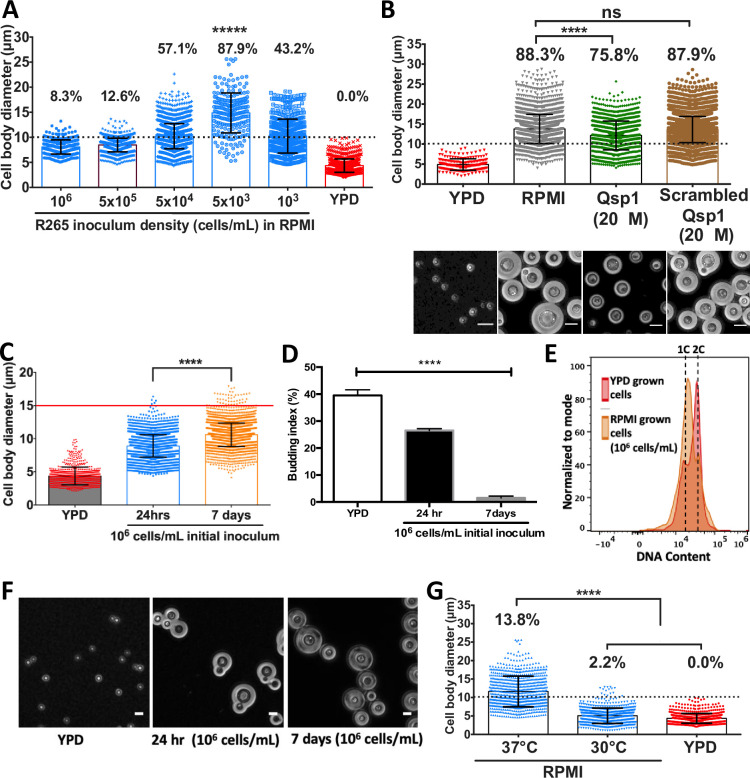
Cryptococcosis is a potentially lethal fungal infection of humans caused by organisms within the Cryptococcus neoformans/gattii species complex. Whilst C. neoformans is a relatively common pathogen of immunocompromised individuals, C. gattii is capable of acting as a primary pathogen of immunocompetent individuals. Within the host, both species undergo morphogenesis to form titan cells: exceptionally large cells that are critical for disease establishment. To date, the induction, defining attributes, and underlying mechanism of titanisation have been mainly characterized in C. neoformans. Here, we report the serendipitous discovery of a simple and robust protocol for in vitro induction of titan cells in C. gattii. Using this in vitro approach, we reveal a remarkably high capacity for titanisation within C. gattii, especially in strains associated with the Pacific Northwest Outbreak, and characterise strain-specific differences within the clade. In particular, this approach demonstrates for the first time that cell size changes, DNA amplification, and budding are not always synchronous during titanisation. Interestingly, however, exhibition of these cell cycle phenotypes was correlated with genes associated with cell cycle progression including CDC11, CLN1, BUB2, and MCM6. Finally, our findings reveal exogenous p-Aminobenzoic acid to be a key inducer of titanisation in this organism. Consequently, this approach offers significant opportunities for future exploration of the underlying mechanism of titanisation in this genus.


Conflict of interest statement

The authors have declared that no competing interests exist.

Figures

Fig 1
Fig 1. C. gattii (R265) exhibits cell body and capsule enlargement in response to growth in RPMI.
A) Micrographs of R265 cells grown in YPD overnight at 25°C in atmospheric conditions (left panel), or at 37°C in an atmosphere of 5% CO2 either in YPD (middle panel) or RPMI (right panel). Scale bar = 15μm. B) Total cell diameter (capsule included), C) cell body diameter (percentages represent percentage of cells more than 10μm in diameter) and D) capsule thickness of R265 cells all significantly increase after growth in RPMI at 37°C in 5% CO2. The graphs represent at least 3 biological experimental repeats, and Kruskal-Wallis test was used to determine significance where **** = p<0.0001 and ns = p>0.05. E) Cellular morphology of R265 enlarged cells: cell body diameter (⍺) and capsule thickness (ß). Scale bar = 15μm.
Fig 2
Fig 2. The cell wall chitin content and ploidy of enlarged cells are typical of titan cells.
In vitro RPMI-generated enlarged cells displayed a significantly higher chitin level relative to YPD grown R265 cells, as indicated by the calcofluor white (CFW) fluorescence intensity shown using microscopy imaging in (A), via flow cytometry in (B) and graphically in (C, Median Fluorescence Intensity, MFI) (p<0.0001). Scale bar = 15μm. Statistical significance was confirmed by Two-tailed t-test. D) Micrograph showing single large central vacuole of in vitro-generated enlarged cells. E) Ploidy measurement of RPMI-generated enlarged cells based on flow cytometry analysis of DAPI staining. YPD grown cells (red) gated as 1C, 2C (haploid) were used as a control to determine ploidy (DNA content) of enlarged cells after 24 hr (blue) and 7 days (orange) of induction. F) Micrographs showing the uninucleate nature of R265 titan cells upon staining with DAPI to visualize the nucleus. Scale bar = 10μm.
Fig 3
Fig 3. Effect of cell density and environmental conditions on R265 titan cell formation.
A) The effect of cell density on cell enlargement was determined by growing R265 cells in titan-inducing conditions at varying concentrations (between 106 and 103 cells/mL, as indicated) and cell size being measured 72 hrs later (percentages indicate proportion of the population >10 μm). B) The role of the quorum sensing peptide, Qsp1 (on titan cell formation) was determined by growing R265 yeast cells in RPMI supplemented with the intact and scrambled peptide (control) at 37°C with 5% CO2 and measuring the cell body size after 72 hr incubation. Microscopy images illustrating the morphological differences in titan cell production between these three conditions (RPMI, intact Qsp1 and scrambled Qsp1) are also shown. Maximum cell enlargement capacity (C), budding index (D) and ploidy (E) of R265 cells in RPMI at 106 cells/mL (high density growth) at 37°C with 5% CO2 for 24 hr and 7 days. Budding index was expressed as percentage of budded cells per total number of cells. At least >3000 cells were analysed for each sample from two independent repeats and significance was determined by one-way ANOVA (**** = p<0.0001). (E) Cells recovered from 7 day high-density induction cultures were analysed for ploidy (orange) which was consistent with a 1C and 2C haploid DNA content as found for the YPD grown cells (red). F) Microscopy images depicting the budding index of cells grown in YPD (left panel), RPMI for 24hr (middle panel) and RPMI for 7days (right panel). Scale bar: 10μm. G) Impact of temperature and 5% CO2 growth: cell body diameter of R265 cells after 24hrs of growth in RPMI with 5% CO2 at 37°C or 30°C. The graphs represent at least 3 biological experimental repeats, and Kruskal-Wallis test was used to determine significance where **** = p<0.0001.
Fig 4
Fig 4. Cell enlargement, polyploidization and budding occur at different periods during titan induction in R265.
A) Cell body diameter of R265 titan cells over prolonged induction (24 hr to 21 days) as compared to YPD grown cells. Enlarged cells were recovered at different time points, fixed and measured. The error bars represent median of 3 biological repeats, where **** = p<0.0001. B) Samples from all the induction time points were fixed, DAPI stained and analysed for ploidy by flow cytometry with reference to YPD grown cells, which were used to gate for 1C and 2C DNA content. C) Budding index of cells recovered from YPD and titan inducing condition. Budding index was expressed as percentage of budded cells per total number of cells. At least 3000 cells were analysed for each sample (the graph represents three biological repeats and significance was confirmed by one-way ANOVA, where **** = p<0.0001 D) Microscopy images showing the budding nature of cells obtained from YPD or at various timepoints after titan induction. Scale bar: 15μm.
Fig 5
Fig 5. Characterization of daughter cells and metabolic state of R265 titan cells.
7 day old R265 titan cells were purified using a 20μm cell strainer (A) and then B) re-cultured overnight in YPD to induce budding. C) After 24hrs, daughter cells of R265 titan cells were isolated by filtration of the titan culture (through a>15μm cell strainer) and microscopically compared with D) YPD grown yeast R265 cells (control). E) Microscopy images demonstrating the metabolic activity titan cells from 7 days old cultured (fresh vs heat-killed) and YPD grown yeast cells (fresh vs heat-killed). The cells were stained with the metabolic reporter dye Fun-1 which is converted from yellow-green to orange-red by metabolically active cells. Scale bar = 10μm. F) DNA content of titan-derived daughter cells (Blue) cells as compared to YPD grown (red) and>20μm R265 titan cells (brown). G) Size distribution of daughter cells (blue), YPD grown (red) and>20μm R265 titan cells (brown).
Fig 6
Fig 6. Relative transcription of R265 cell cycle marker genes during titanisation.
Quantitative expression analysis of four different cell cycle associated genes in R265 grown in either YPD (control) or titanising conditions for the indicated time points. Expression is shown relative to the housekeeping gene GAPDH. Genes quantified were A) CDC11 (CNBG_5339), involved in bud formation; B) CLN1 (CNBG_4803), associated with balancing cell division and DNA replication [18]; C) MCM6 (CNBG_5506), involved in DNA replication; and D) BUB2 (CNBG_4446), involved in G2 arrest. The graphs represent 3 biological repeats (3 technical replicates each), with error bars depicting the standard deviation of delta-delta CT values.
Fig 7
Fig 7. The effect of RPMI-specific compounds on R265 titan cell formation.
A) RPMI-specific amino acids (L-Glutamic acid, L-Aspartic acid, L-Arginine, L-Glutathione, L-Asparagine and L-Proline) were added to DMEM either at the concentration used in RPMI (‘low conc.’) or two-fold higher (‘high conc.’) and tested for their capacity to trigger titan cell formation after 24 hr induction at 37°C in 5% CO2. B) RPMI-specific compounds (Vitamin B12, Biotin, and para aminobenzoic acid (pABA)) were supplemented to DMEM at the levels present in RPMI and then evaluated for their capacity to induce titan cell formation after 3 days incubation at 37°C in 5% CO2. The graphs are representation of 3 biological repeats and statistical significance was determined by Kruskal-Wallis test, where **** = p<0.0001.
Fig 8
Fig 8. Capacity to form titan cells of C. gattii progeny arising from two crosses.
(A) Titanisation pattern following three days of induction for R265 (VGII) x LA584 (VGII) and 13 progeny (Alg23-Alg35) arising from this cross [33]. (B) Titanisation pattern following three days of induction of R265 (VGII) x B4564 (VGIII) and 18 of the progeny (P1-P18) arising from this cross.

References

    1. May RC, Stone NR, Wiesner DL, Bicanic T, Nielsen K. Cryptococcus: from environmental saprophyte to global pathogen. Nat Rev Microbiol. 2016;14: 106–117. doi: 10.1038/nrmicro.2015.6 - DOI - PMC - PubMed
    1. Bielska E, May RC. What makes Cryptococcus gattii a pathogen? FEMS Yeast Res. 2016;16: fov106. doi: 10.1093/femsyr/fov106 - DOI - PubMed
    1. Kwon-Chung KJ, Fraser JA, Doering TL, Wang Z, Janbon G, Idnurm A et al.. Cryptococcus neoformans and Cryptococcus gattii, the etiologic agents of cryptococcosis. Cold Spring Harb Perspect Med. 2014;4: a019760. doi: 10.1101/cshperspect.a019760 - DOI - PMC - PubMed
    1. Cooney NM, Klein BS. Fungal adaptation to the mammalian host: it is a new world, after all. Curr Opin Microbiol. 2008;11: 511–516. doi: 10.1016/j.mib.2008年09月01日8 - DOI - PMC - PubMed
    1. Ballou ER, Johnston SA. The cause and effect of Cryptococcus interactions with the host. Curr Opin Microbiol. 2017;40: 88–94. doi: 10.1016/j.mib.2017年10月01日2 - DOI - PubMed

Substances

Cite

AltStyle によって変換されたページ (->オリジナル) /