This site needs JavaScript to work properly. Please enable it to take advantage of the complete set of features!
Skip to main page content
U.S. flag

An official website of the United States government

Dot gov

The .gov means it’s official.
Federal government websites often end in .gov or .mil. Before sharing sensitive information, make sure you’re on a federal government site.

Https

The site is secure.
The https:// ensures that you are connecting to the official website and that any information you provide is encrypted and transmitted securely.

NIH NLM Logo
Log in
Access keys NCBI Homepage MyNCBI Homepage Main Content Main Navigation
. 2021 Apr 28;7(18):eabd4742.
doi: 10.1126/sciadv.abd4742. Print 2021 Apr.

Pooled CRISPR screening identifies m6A as a positive regulator of macrophage activation

Affiliations

Pooled CRISPR screening identifies m6A as a positive regulator of macrophage activation

Jiyu Tong et al. Sci Adv. .

Abstract

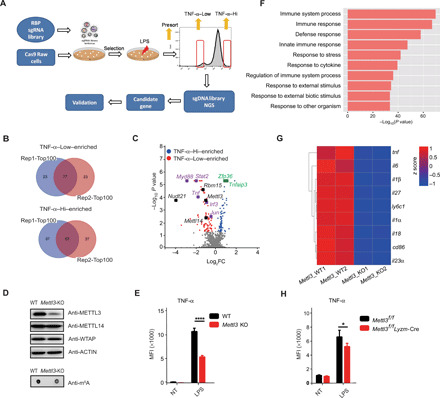
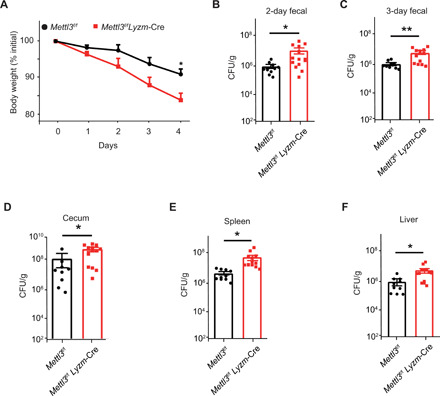
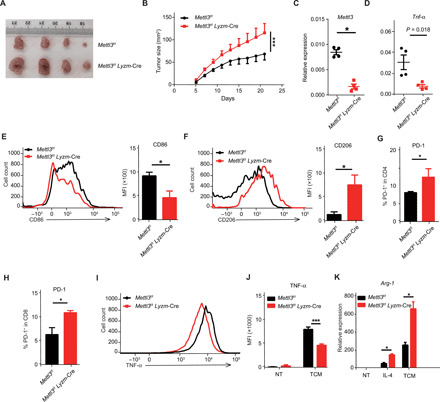
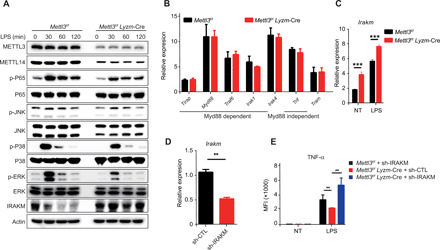
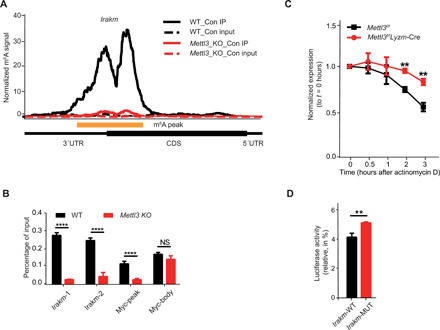
m6A RNA modification is implicated in multiple cellular responses. However, its function in the innate immune cells is poorly understood. Here, we identified major m6A "writers" as the top candidate genes regulating macrophage activation by LPS in an RNA binding protein focused CRISPR screening. We have confirmed that Mettl3-deficient macrophages exhibited reduced TNF-α production upon LPS stimulation in vitro. Consistently, Mettl3 flox/flox;Lyzm-Cre mice displayed increased susceptibility to bacterial infection and showed faster tumor growth. Mechanistically, the transcripts of the Irakm gene encoding a negative regulator of TLR4 signaling were highly decorated by m6A modification. METTL3 deficiency led to the loss of m6A modification on Irakm mRNA and slowed down its degradation, resulting in a higher level of IRAKM, which ultimately suppressed TLR signaling-mediated macrophage activation. Our findings demonstrate a previously unknown role for METTL3-mediated m6A modification in innate immune responses and implicate the m6A machinery as a potential cancer immunotherapy target.


Figures

Fig. 1
Fig. 1. CRISPR screening identifies METTL3 as a regulator of TNF-α production in macrophages.
(A) Scheme of pooled CRISPR-Cas9 screening of RBPs playing critical roles in macrophage activation. Briefly, Cas9-expressing Raw 264.7 cells were infected with lentivirus library containing sgRNAs targeting RBP genes in the mouse genome. After selection with puromycin for 7 days, the cells were stimulated with LPS and sorted by flow cytometry on the basis of the expression levels of TNF-α. (B) Venn diagrams showing the overlap between the top 100 ranked candidate genes enriched in TNF-α–Low and TNF-α–Hi populations in two replicate screens. (C) Volcano plot showing sgRNA-targeted genes enriched in the TNF-α–Hi (blue) and TNF-α–Low (red) populations. Known positive regulators (purple), negative regulators (green), and m6A modulators (black) of TNF-α production in macrophages are highlighted. (D) Protein level of METTL3 and the overall RNA m6A methylation levels in WT and Mettl3-KO Raw 264.7 cells were measured by Western blotting and m6A dot blot assay. (E) Expression of TNF-α in METTL3-depleted and control Raw 264.7 cells after LPS stimulation measured by flow cytometry. MFI, median fluorescence intensity; NT, not treated. (F) GO enrichment analysis of down-regulated transcripts in Mettl3-KO Raw 264.7 cells compared to WT control cells. (G) Heatmap illustrating the expression of transcripts downstream of the TLR4 signaling pathway in Mettl3-deficient and WT Raw 264.7 cells. (H) Expression of TNF-α in bone marrow–derived macrophages (BMDMs) from Mettl3flox/flox;Lyzm-Cre and Mettl3flox/flox control mice upon LPS stimulation measured by flow cytometry. Data are shown from two experiments (B and C), as a representative result of three independent experiments (D), or as means ± SEM (E and H).*P < 0.05 and ****P < 0.0001 (unpaired two-tailed Student’s t test).
Fig. 2
Fig. 2. Mettl3flox/flox;Lyzm-Cre mice are more susceptible to S. typhimurium infection.
(A) Body weight of Mettl3flox/flox;Lyzm-Cre (n = 14) and their Mettl3flox/flox littermates (n = 10) measured 2 and 3 days after S. typhimurium infection. (B to F) Bacteria load of the feces (B and C), cecum (D), spleen (E), and liver (F) of infected Mettl3flox/flox;Lyzm-Cre (n = 14) and Mettl3flox/flox littermates (n = 10) measured by counting colony-forming units (CFU) in cultures of serially diluted homogenates of organs on MacConkey agar plates. Data are shown as representative results of three independent experiments (A to F) or as means ± SD of indicated determinants (B to F). *P < 0.05 and **P < 0.01 (unpaired two-tailed Student’s t test).
Fig. 3
Fig. 3. Mettl3flox/flox;Lyzm-Cre mice exhibit faster tumor growth and a lower level of macrophage-derived TNF-α than WT littermates.
MC38 cells were subcutaneously injected into the flanks of Mettl3flox/flox;Lyzm-Cre mice and their Mettl3flox/flox littermates. The tumor was excised, and tumor-infiltrating cells were characterized by flow cytometry and real-time qPCR. (A) Representative images of tumors excised from Mettl3flox/flox;Lyzm-Cre mice (n = 10) and Mettl3flox/flox littermates (n = 10) 21 days after cell injection. Photo credit: Jiyu Tong, Shanghai Jiao Tong University School of Medicine. (B) Tumor growth in Mettl3flox/flox;Lyzm-Cre mice (n = 10) and Mettl3flox/flox littermates (n = 10). (C and D) Relative expression of Mettl3 (C) and Tnf-α (D) in TAMs from Mettl3flox/flox;Lyzm-Cre mice (n = 4) and Mettl3flox/flox littermates (n = 4) measured by real-time qPCR. (E and F) Flow cytometry profile and MFI of CD86-positive (E) and CD206-positive (F) TAMs from Mettl3flox/flox;Lyzm-Cre mice (n = 4) and Mettl3flox/flox littermates (n = 4). (G and H) Fractions of intratumoral PD-1–positive CD4+ T cells (G) and PD-1–positive CD8+ T cells (H) measured by flow cytometry (n = 3). (I and J) BMDMs from Mettl3flox/flox;Lyzm-Cre mice and Mettl3flox/flox littermates were stimulated with medium conditioned by MC38 tumor cells in vitro. The expression of TNF-α was measured by flow cytometry and shown as a histogram (I) and MFI (J). Arg-1 expression in TAMs from Mettl3flox/flox;Lyzm-Cre mice and Mettl3flox/flox littermates measured by real-time qPCR after TCM or IL-4 treatment. Data are shown as representative results of three independent experiments (A, E, F, and I), as means ± SD (B, G, and H), or as means ± SEM (C to F, J, and K). *P < 0.05 and ***P < 0.001 (unpaired two-tailed Student’s t test).
Fig. 4
Fig. 4. METTL3 deficiency impairs the TLR4 signaling pathway by modulating IRAKM expression.
(A) Activation of the TLR4 signaling pathway in Mettl3-KO and Mettl3-WT BMDMs upon LPS stimulation was analyzed by Western blotting of p65, JNK, p38, ERK, and IRAKM. (B) Relative expression of Tirap, Myd88, Traf6, Irak, Irak4, Trif, and Tram in Mettl3flox/flox;Lyzm-Cre mice and Mettl3flox/flox littermates measured by real-time qPCR. (C) Relative expression of Irakm in control (NT) and LPS-treated Mettl3flox/flox;Lyzm-Cre and Mettl3flox/flox littermates measured by real-time qPCR. (D) Knockdown efficiency of shRNA targeting Irakm in BMDMs measured by real-time qPCR (n = 3). (E) TNF-α synthesis in WT BMDMs transfected with control shRNA (sh-CTL) and Mettl3-deficient BMDMs transfected with sh-CTL or IRAKM shRNA (sh-IRAKM) measured by flow cytometry (n = 3). Data are shown as representative results of three independent experiments (A) or as means ± SEM (B to E). **P < 0.01 and ***P < 0.001 (unpaired two-tailed Student’s t test).
Fig. 5
Fig. 5. IRAKM expression is down-regulated by m6A modification.
(A) Specific m6A peaks enriched in the 3′UTR of Irakm mRNAs in Raw 264.7 macrophages profiled using MeRIP-seq. CDS, coding sequences. (B) m6A peaks enriched in the 3′UTR of Irakm mRNAs in WT cells were lost in Mettl3-KO Raw 264.7 cells. (C) WT or Mettl3-deficient BMDMs were treated with the transcription inhibitor actinomycin D, and the level of Irakm transcripts was measured over time. (D) Relative luciferase activity of pGL4-luc2 with WT-3′UTR (IRAKM-WT) or with IRAKM-3′UTR containing mutated m6A sites (IRAKM-MUT) transfected into HEK293T cells was measured. The firefly luciferase activity was normalized to Renilla luciferase activity. Data are shown as representative results of three independent experiments (A) or as means ± SEM (B to D). **P < 0.01 and ****P < 0.0001; NS, not significant (unpaired two-tailed Student’s t test).

References

    1. Kawai T., Akira S., Toll-like receptors and their crosstalk with other innate receptors in infection and immunity. Immunity 34, 637–650 (2011). - PubMed
    1. Murray P. J., Macrophage polarization. Annu. Rev. Physiol. 79, 541–566 (2017). - PubMed
    1. Noy R., Pollard J. W., Tumor-associated macrophages: From mechanisms to therapy. Immunity 41, 49–61 (2014). - PMC - PubMed
    1. Vitale I., Manic G., Coussens L. M., Kroemer G., Galluzzi L., Macrophages and metabolism in the tumor microenvironment. Cell Metab. 30, 36–50 (2019). - PubMed
    1. DeNardo D. G., Ruffell B., Macrophages as regulators of tumour immunity and immunotherapy. Nat. Rev. Immunol. 19, 369–382 (2019). - PMC - PubMed

Publication types

MeSH terms

Cite

AltStyle によって変換されたページ (->オリジナル) /