Trends of Malaria Morbidity and Mortality from 2010 to 2017 in Bale Zone, Ethiopia: Analysis of Surveillance Data
- PMID: 33324077
- PMCID: PMC7733415
- DOI: 10.2147/IDR.S284281
Trends of Malaria Morbidity and Mortality from 2010 to 2017 in Bale Zone, Ethiopia: Analysis of Surveillance Data
Abstract
Background: Malaria is the major public health problem in sub-Saharan Africa, including Ethiopia. Ongoing malaria surveillance data analysis is useful for assessing incidences, trends over time, and evaluating the effectiveness of malaria prevention and control programs.
Objective: To describe trends in malaria morbidity and mortality from 2010 to 2017 using surveillance data in Bale zone, Southeast Ethiopia.
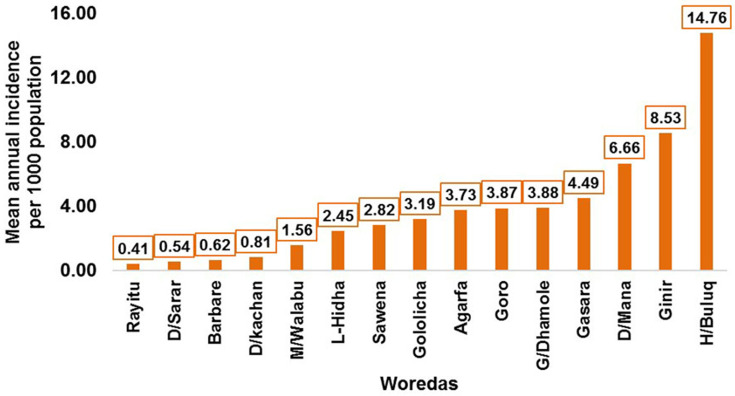
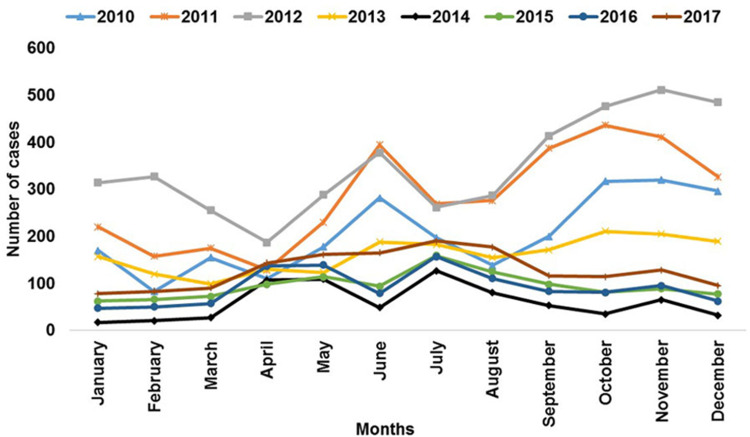
Methods: A retrospective study was conducted. Data were extracted from a public health emergency management surveillance database of Bale zonal health department. Data were entered into Microsoft office Excels worksheet 2016 and analyzed using Epi info version 7.2 software. Descriptive statistics was employed to calculate frequencies and percentages of malaria cases, trends of malaria transmission in terms of years, plasmodium species, gender, age, geographical and seasonal distribution. Malaria morbidity were assessed using the incidence rate of malaria cases per 1,000 population at risk and analyzed by year.
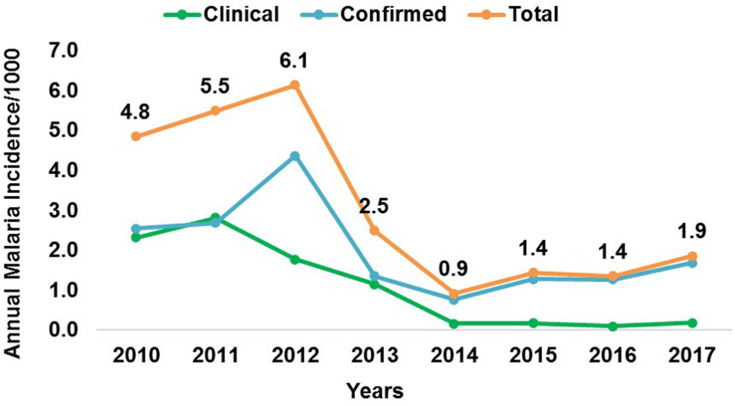
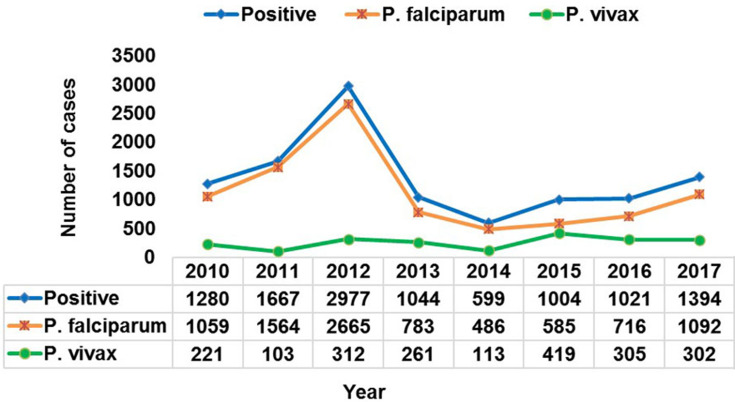
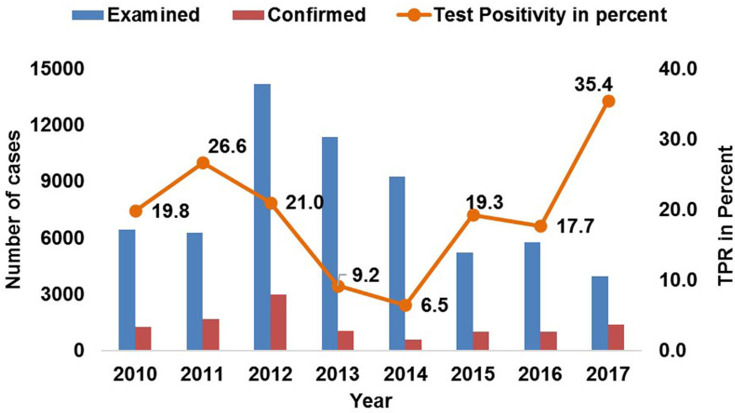
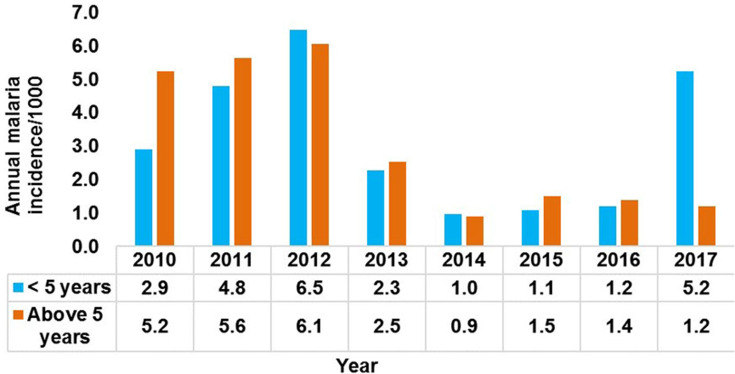
Results: A total of 16,465 malaria cases were reported over 8 years. Of these, 10,986 (66.7%) were confirmed cases by microscopy/rapid diagnostic test. The majority of the cases, 82.2%, were reported among the >5 years age group and 62.9% were males. The overall 8 years average annual incidence was 3.1 cases/1,000 population at risk. There was an increase in incidence by 26% between 2010-2012, then a fall by 85% from 2012-2014, with another increaseby 52% from 2014-2017. The majority of the confirmed cases (81.5%) were due to Plasmodium falciparum species. The overall 8 years average annual death rate from malaria was 0.15/100,000 population.
Conclusion: Even though a substantial reduction in morbidity and mortality of malaria was achieved, the possibility of observing severe cases was higher in the study area. Hence, the prevention and control program should be sustained and adjusted to address Plasmodium falciparum species.
Keywords: Bale zone; Southeast Ethiopia; incidence; malaria; morbidity; mortality; trend.
© 2020 Sani Kalil et al.
Conflict of interest statement
The authors declare that they have no competing interests.
Figures
References
-
- Gerhard V, Pat D, David D, et al. A novel approach for modeling malaria incidence using complex categorical household data: the minimum message length (MML) method applied to Indonesian Data. Comput Ecol Softw. 2012;2(3):140–159.
-
- World Health Organization. World malaria report 2017. Geneva, Switzerland: WHO; 2017.
-
- Shepard DS, Ettling MB, Brinkmann U, et al. The economic cost of malaria in Africa. Trop Med Parasitol. 1991;42(3):199–203. - PubMed
-
- Ethiopian Public Health Institute. Ethiopia National Malaria Indicator Survey 2015. Addis Ababa, Ethiopia: Ethiopa Ministry of Health; 2016.
LinkOut - more resources
Full Text Sources