This site needs JavaScript to work properly. Please enable it to take advantage of the complete set of features!
Skip to main page content
U.S. flag

An official website of the United States government

Dot gov

The .gov means it’s official.
Federal government websites often end in .gov or .mil. Before sharing sensitive information, make sure you’re on a federal government site.

Https

The site is secure.
The https:// ensures that you are connecting to the official website and that any information you provide is encrypted and transmitted securely.

NIH NLM Logo
Log in
Access keys NCBI Homepage MyNCBI Homepage Main Content Main Navigation
. 2020 Nov 11;13(1):572.
doi: 10.1186/s13071-020-04447-x.

A spatio-temporal agent-based approach for modeling the spread of zoonotic cutaneous leishmaniasis in northeast Iran

Affiliations

A spatio-temporal agent-based approach for modeling the spread of zoonotic cutaneous leishmaniasis in northeast Iran

Mohammad Tabasi et al. Parasit Vectors. .

Abstract

Background: Zoonotic cutaneous leishmaniasis (ZCL) is a neglected tropical disease worldwide, especially the Middle East. Although previous works attempt to model the ZCL spread using various environmental factors, the interactions between vectors (Phlebotomus papatasi), reservoir hosts, humans, and the environment can affect its spread. Considering all of these aspects is not a trivial task.

Methods: An agent-based model (ABM) is a relatively new approach that provides a framework for analyzing the heterogeneity of the interactions, along with biological and environmental factors in such complex systems. The objective of this research is to design and develop an ABM that uses Geospatial Information System (GIS) capabilities, biological behaviors of vectors and reservoir hosts, and an improved Susceptible-Exposed-Infected-Recovered (SEIR) epidemic model to explore the spread of ZCL. Various scenarios were implemented to analyze the future ZCL spreads in different parts of Maraveh Tappeh County, in the northeast region of Golestan Province in northeastern Iran, with alternative socio-ecological conditions.

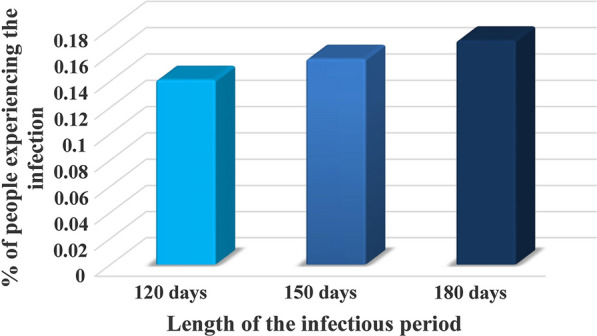
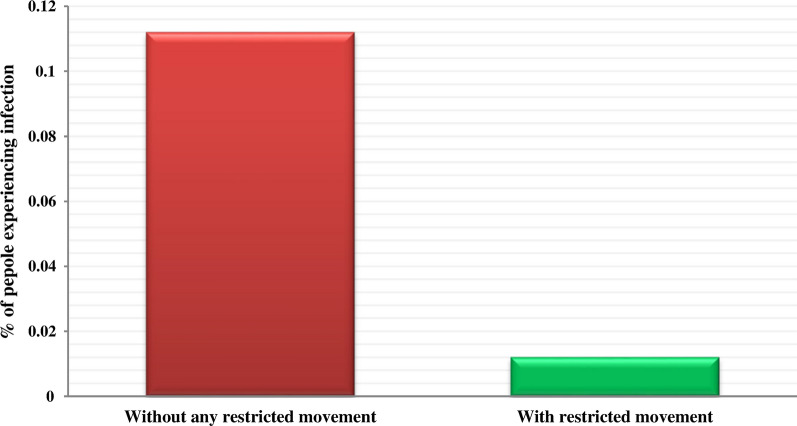
Results: The results confirmed that the spread of the disease arises principally in the desert, low altitude areas, and riverside population centers. The outcomes also showed that the restricting movement of humans reduces the severity of the transmission. Moreover, the spread of ZCL has a particular temporal pattern, since the most prevalent cases occurred in the fall. The evaluation test also showed the similarity between the results and the reported spatiotemporal trends.

Conclusions: This study demonstrates the capability and efficiency of ABM to model and predict the spread of ZCL. The results of the presented approach can be considered as a guide for public health management and controlling the vector population .

Keywords: Agent-based model; Geospatial information system; Susceptible-Exposed-Infected-Recovered model; Zoonotic cutaneous leishmaniasis.


Conflict of interest statement

The authors declare that they have no competing interests.

Figures

Fig. 1
Fig. 1
Location of the study area, Maraveh Tappeh, Golestan, Iran. The maps were illustrated using ArcMap version 10.2 based on geospatial data obtained from National Cartographic Center (NCC), Iran
Fig. 2
Fig. 2
Input evidence maps for the ABM. Both normalized differentiated vegetation index (NDVI) and digital elevation model (DEM) were extracted from the United States Geological Survey (USGS) (https://gdex.cr.usgs.gov/gdex/) and were mapped in ArcMap version 10.2. These indexes were collected from the ASTER platform at 90 meters resolution
Fig. 3
Fig. 3
UML class diagram of the ZCL model
Fig. 4
Fig. 4
Display of the ZCL model by utilizing the UML sequence diagram
Fig. 5
Fig. 5
ZCL transmission through the interaction of sand fly, human, rodent, and the environment
Fig. 6
Fig. 6
SEIR results with different initial populations (human (a), rodent (b), and sand fly (c)). Blue, yellow, red, and green lines refer to susceptible, exposed, infected, and recovered humans, respectively. The left vertical axis in all charts indicates the number of susceptible humans. The right vertical axis in all charts shows the number of exposed, infected, and recovered humans
Fig. 7
Fig. 7
The human infection percentage throughout the epidemic in response to different infectious periods. The vertical axis of the chart indicates the percentage of infected humans. The horizontal axis of the chart refers to the infectious periods of humans
Fig. 8
Fig. 8
SEIR results with different initial infected populations (rodent (a) and sand fly (b)). Blue, yellow, red, and green lines refer to susceptible, exposed, infected, and recovered humans, respectively. The left vertical axis in all charts indicates the number of susceptible humans. The right vertical axis in all charts shows the number of exposed, infected, and recovered humans
Fig. 9
Fig. 9
The human infection proportion in the case study in response to the two-movement rules. The red box indicates the percentage of infected humans for whom there was no movement restriction. The green box shows the percentage of infected humans for whom there was movement restriction
Fig. 10
Fig. 10
Comparison of simulation results with reality in terms of the proportion of infected humans in three endemic areas in the case study. This map was obtained from the United States Geological Survey (USGS) (https://gdex.cr.usgs.gov/gdex/) and was displayed in ArcMap version 10.2
Fig. 11
Fig. 11
a Spatial pattern of ZCL during the consecutive time steps in the Maraveh Tappeh County. b Population density of village residents in the study area. In panel a, bold red areas indicate regions with the highest levels of the infection. In panel b, bold red areas show regions with the highest population density, and blue areas indicate the lowest population density. The maps were prepared by ArcMap version 10.2
Fig. 12
Fig. 12
Comparison of simulation results with reality in terms of the temporal pattern of ZCL

References

    1. Yaghoobi-Ershadi MR. Phlebotomine sand flies (Diptera: Psychodidae) in Iran and their role on leishmania transmission. J Arthropod Borne Dis. 2012;6:1–17. - PMC - PubMed
    1. WHO . Control of the leishmaniases. Geneva: World Health Organization Technical Report Series; 2010. - PubMed
    1. Alvar J, Vélez ID, Bern C, Herrero M, Desjeux P, Cano J, et al. Leishmaniasis worldwide and global estimates of its incidence. PLoS ONE. 2012;7:e35671. doi: 10.1371/journal.pone.0035671. - DOI - PMC - PubMed
    1. Karimi A, Hanafi-Bojd AA, Yaghoobi-Ershadi MR, Akhavan AA, Ghezelbash Z. Spatial and temporal distributions of phlebotomine sand flies (Diptera: Psychodidae), vectors of leishmaniasis, Iran. Acta Trop. 2014;1(132):131–139. doi: 10.1016/j.actatropica.201401004. - DOI - PubMed
    1. Rassi Y, Sofizadeh A, Abai MR, Oshaghi MA, Rafizadeh S, Mohebail M, et al. Molecular detection of Leishmania major in the vectors and reservoir hosts of cutaneous leishmaniasis in Kalaleh District, Golestan Province, Iran. J Arthropod Borne Dis. 2008;2:21–27.
Cite

AltStyle によって変換されたページ (->オリジナル) /