This site needs JavaScript to work properly. Please enable it to take advantage of the complete set of features!
Skip to main page content
U.S. flag

An official website of the United States government

Dot gov

The .gov means it’s official.
Federal government websites often end in .gov or .mil. Before sharing sensitive information, make sure you’re on a federal government site.

Https

The site is secure.
The https:// ensures that you are connecting to the official website and that any information you provide is encrypted and transmitted securely.

NIH NLM Logo
Log in
Access keys NCBI Homepage MyNCBI Homepage Main Content Main Navigation
. 2020 Nov 3;9(1):153.
doi: 10.1186/s40249-020-00772-6.

Spatiotemporal dynamics, risk areas and social determinants of dengue in Northeastern Brazil, 2014-2017: an ecological study

Affiliations

Spatiotemporal dynamics, risk areas and social determinants of dengue in Northeastern Brazil, 2014-2017: an ecological study

Rodrigo Feliciano do Carmo et al. Infect Dis Poverty. .

Abstract

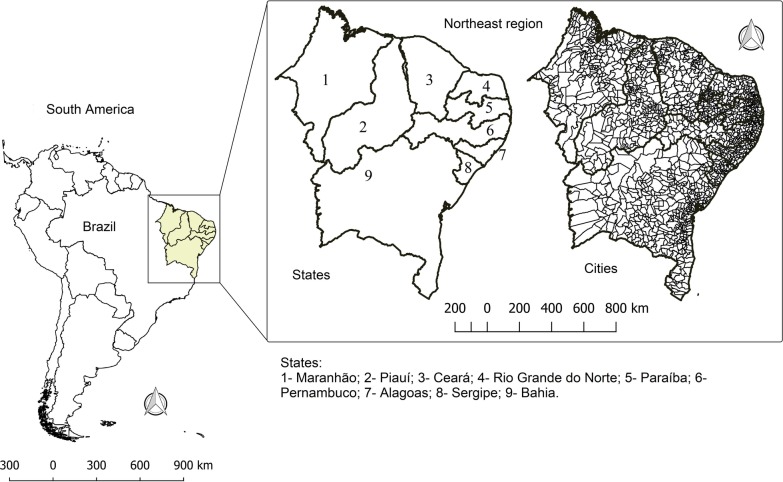
Background: Dengue fever is an arthropod-borne viral disease caused by dengue virus (DENV) and transmitted by Aedes mosquitoes. The Northeast region of Brazil is characterized by having one of the highest dengue rates in the country, in addition to being considered the poorest region. Here, we aimed to identify spatial clusters with the highest dengue risk, as well as to analyze the temporal behavior of the incidence rate and the effects of social determinants on the disease transmission dynamic in Northeastern Brazil.

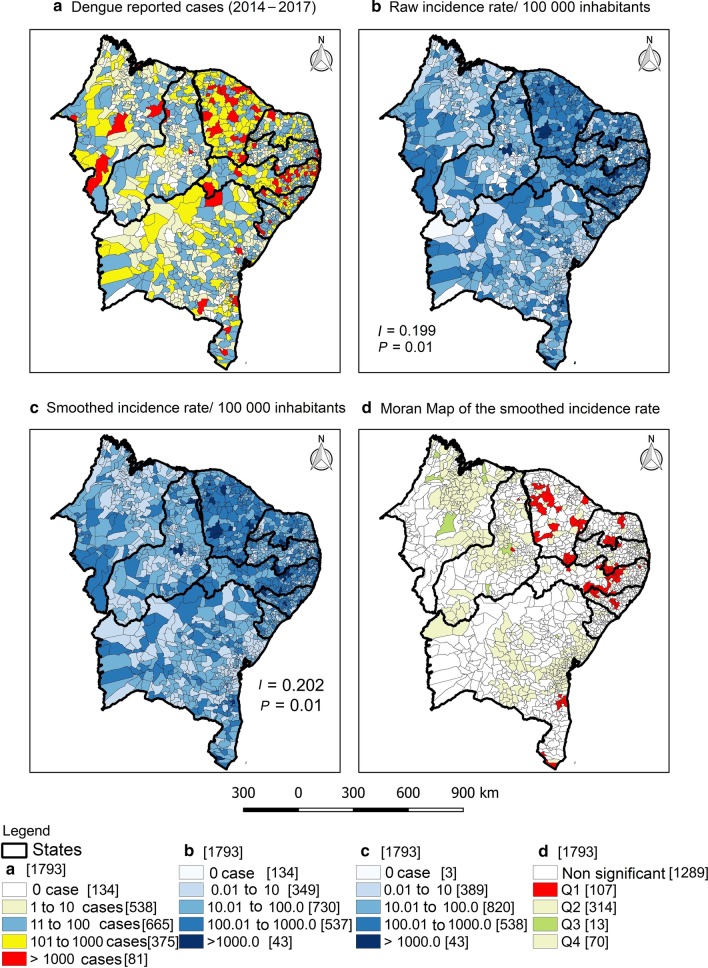
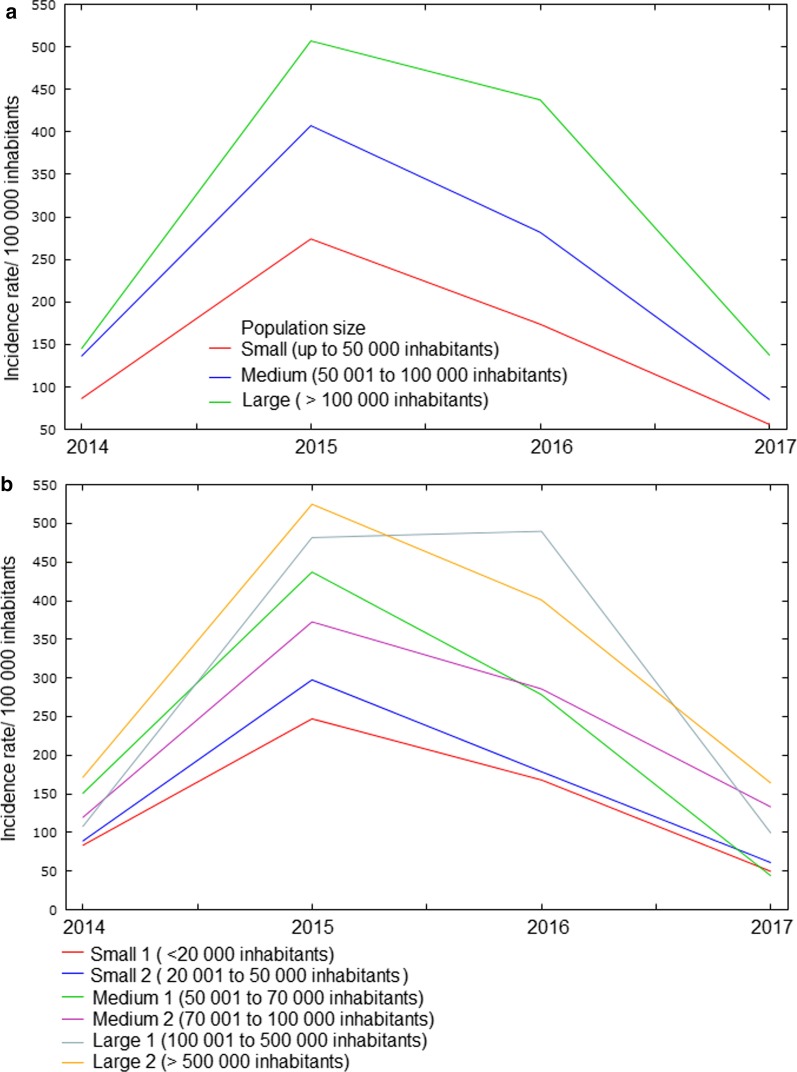
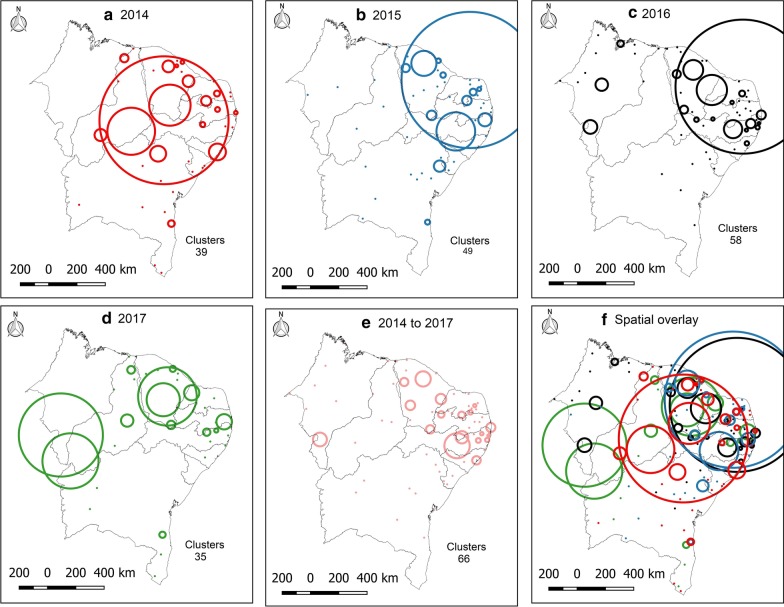
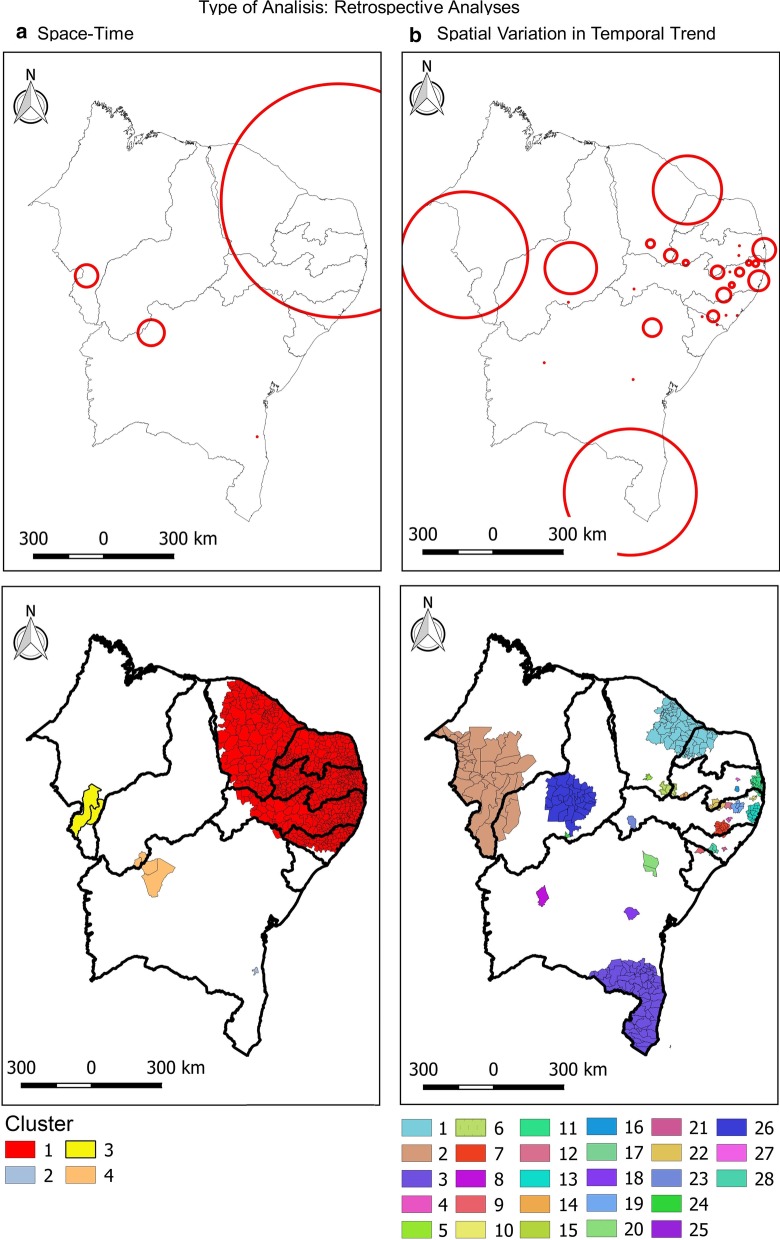
Methods: This is an ecological study carried out with all confirmed cases of dengue in the Northeast Brazil between 2014 and 2017. Data were extracted from the National Notifiable Diseases Information System (SINAN) and the Brazilian Institute of Geography and Statistics (IBGE). Local empirical Bayesian model, Moran statistics and spatial scan statistics were applied. The association between dengue incidence rate and social determinants was tested using Moran's bivariate correlation.

Results: A total of 509 261 cases of dengue were confirmed in the Northeast during the study period, 53.41% of them were concentrated in Pernambuco and Ceará states. Spatial analysis showed a heterogeneous distribution of dengue cases in the region, with the highest rates in the east coast. Four risk clusters were observed, involving 815 municipalities (45.45%). Moreover, social indicators related to population density, education, income, housing, and social vulnerability showed a spatial correlation with the dengue incidence rate.

Conclusions: This study provides information on the spatial dynamics of dengue in northeastern Brazil and its relationship with social determinants and can be used in the formulation of public health policies to reduce the impact of the disease in vulnerable populations.

Keywords: Arboviruses; Dengue; Dengue virus; Epidemiology; GIS; Poverty.


Conflict of interest statement

The authors declare that they have no competing interests.

Figures

Fig. 1
Fig. 1
Location of the study area. Northeast, Brazil. 2020
Fig. 2
Fig. 2
Exploratory spatial analysis of the occurrence of dengue in Northeast Brazil, 2014–2017. a Number of dengue reported cases, b raw incidence rate/100 000 inhabitants, c smoothed incidence rate/100 000 inhabitants and d Moran Map of the smoothed incidence rate. Values in brackets represent the number of municipalities. I = Moran’s Index
Fig. 3
Fig. 3
Dengue incidence rate according to the population size of municipalities in Northeast Brazil, 2014–2017
Fig. 4
Fig. 4
Statistics of spatial scanning of the incidence of dengue in Northeast Brazil. a 2014; b 2015; c 2016; d 2017; e 2014–2017; f Spatial overlay. Circles represent clusters of incidence
Fig. 5
Fig. 5
Retrospective analysis of space–time and spatial variation in the temporal trend of dengue incidence in Brazil Northeast, 2014–2017. a Space–time; b spatial variation in temporal trend. Circles represent spatial clusters in kilometers. Areas in color represent clusters in the level of municipalities

References

    1. Bhatt S, Gething PW, Brady OJ, Messina JP, Farlow AW, Moyes CL, et al. The global distribution and burden of dengue. Nature. 2013;496:504–507. doi: 10.1038/nature12060. - DOI - PMC - PubMed
    1. Guzman MG, Gubler DJ, Izquierdo A, Martinez E, Halstead SB. Dengue infection. Nat Rev Dis Primers. 2016;2:1–25. doi: 10.1038/nrdp.2016.55. - DOI - PubMed
    1. Guzman MG, Harris E. Dengue. Lancet. 2015;385:453–465. doi: 10.1016/S0140-6736(14)60572-9. - DOI - PubMed
    1. San Martín JL, Brathwaite O, Zambrano B, Solórzano JO, Bouckenooghe A, Dayan GH, et al. The epidemiology of dengue in the Americas over the last three decades: a worrisome reality. Am J Trop Med Hyg. 2010;82:128–135. doi: 10.4269/ajtmh.2010.09-0346. - DOI - PMC - PubMed
    1. Teurlai M, Menkès CE, Cavarero V, Degallier N, Descloux E, Grangeon J-P, et al. Socio-economic and climate factors associated with dengue fever spatial heterogeneity: a worked example in New Caledonia. PLoS Negl Trop Dis. 2015;9:e0004211. doi: 10.1371/journal.pntd.0004211. - DOI - PMC - PubMed
Cite

AltStyle によって変換されたページ (->オリジナル) /