This site needs JavaScript to work properly. Please enable it to take advantage of the complete set of features!
Skip to main page content
U.S. flag

An official website of the United States government

Dot gov

The .gov means it’s official.
Federal government websites often end in .gov or .mil. Before sharing sensitive information, make sure you’re on a federal government site.

Https

The site is secure.
The https:// ensures that you are connecting to the official website and that any information you provide is encrypted and transmitted securely.

NIH NLM Logo
Log in
Access keys NCBI Homepage MyNCBI Homepage Main Content Main Navigation
. 2020 Sep 8;117(36):22597-22602.
doi: 10.1073/pnas.2005476117. Epub 2020 Aug 21.

Estimating unobserved SARS-CoV-2 infections in the United States

Affiliations

Estimating unobserved SARS-CoV-2 infections in the United States

T Alex Perkins et al. Proc Natl Acad Sci U S A. .

Abstract

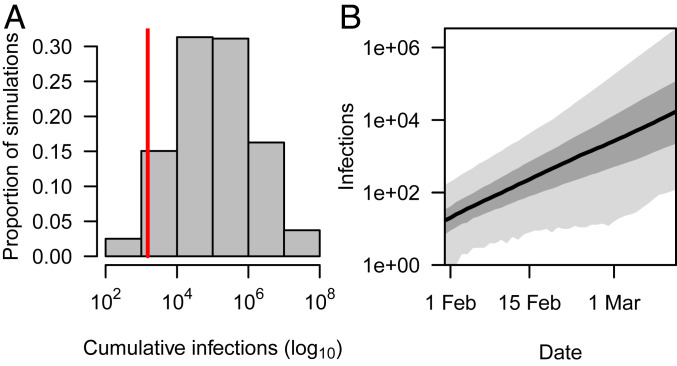
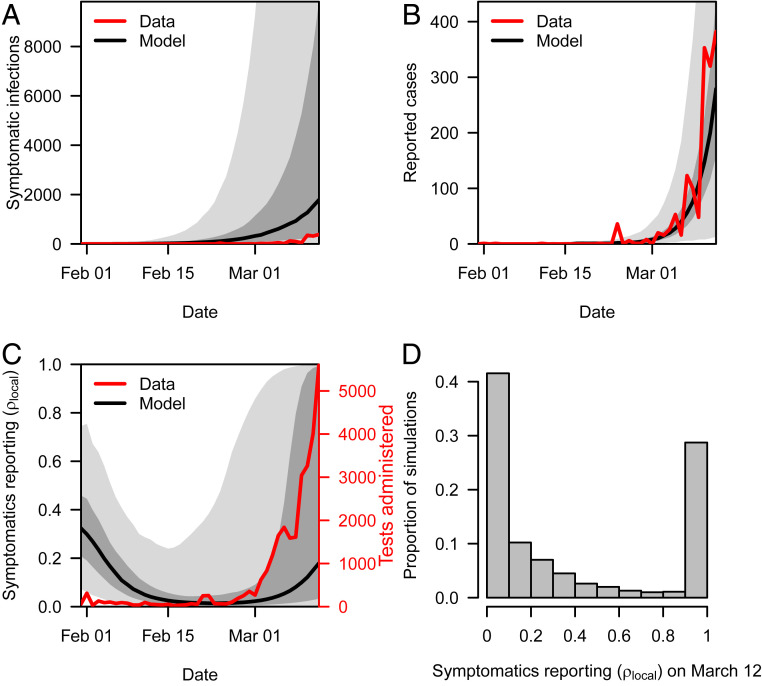
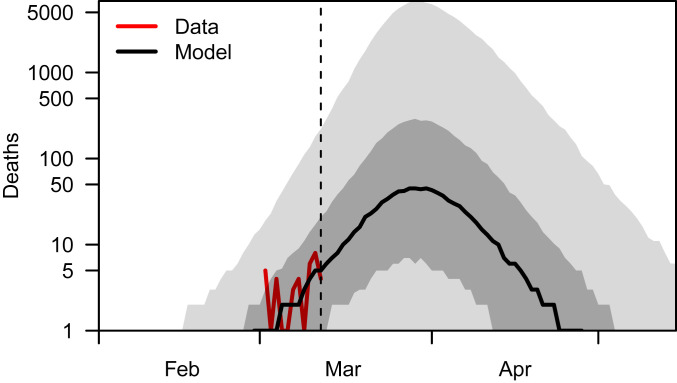
By March 2020, COVID-19 led to thousands of deaths and disrupted economic activity worldwide. As a result of narrow case definitions and limited capacity for testing, the number of unobserved severe acute respiratory syndrome coronavirus 2 (SARS-CoV-2) infections during its initial invasion of the United States remains unknown. We developed an approach for estimating the number of unobserved infections based on data that are commonly available shortly after the emergence of a new infectious disease. The logic of our approach is, in essence, that there are bounds on the amount of exponential growth of new infections that can occur during the first few weeks after imported cases start appearing. Applying that logic to data on imported cases and local deaths in the United States through 12 March, we estimated that 108,689 (95% posterior predictive interval [95% PPI]: 1,023 to 14,182,310) infections occurred in the United States by this date. By comparing the model's predictions of symptomatic infections with local cases reported over time, we obtained daily estimates of the proportion of symptomatic infections detected by surveillance. This revealed that detection of symptomatic infections decreased throughout February as exponential growth of infections outpaced increases in testing. Between 24 February and 12 March, we estimated an increase in detection of symptomatic infections, which was strongly correlated (median: 0.98; 95% PPI: 0.66 to 0.98) with increases in testing. These results suggest that testing was a major limiting factor in assessing the extent of SARS-CoV-2 transmission during its initial invasion of the United States.

Keywords: coronavirus; emerging infectious disease; mathematical modeling; public health surveillance; silent transmission.


Conflict of interest statement

The authors declare no competing interest.

Figures

Fig. 1.
Fig. 1.
Local infections of SARS-CoV-2 in the United States by 12 March. These results derive from our baseline analysis and show (A) cumulative and (B) daily incidence of local infections. In A, the red line shows the cumulative number of reported cases by 12 March (1,514), indicating that the cumulative number of infections exceeded the cumulative number of reported cases in 95.7% of simulations. The model’s predictions of cumulative infections, which were informed by data on cumulative deaths (33) and parameter estimates from the literature (Table 1), exceeded 10,000 in 82.5% of simulations and 100,000 in 51.3% of simulations. In B, the model’s prediction of daily incidence of infection was 100/d or less in early February but grew exponentially to thousands per day by 12 March. The black line shows the median, dark gray shading shows the interquartile range, and light gray shading shows the 95% PPI.
Fig. 2.
Fig. 2.
Comparison of symptomatic infections and reported cases. (A) Local symptomatic infections predicted under the baseline analysis (black and gray) increased exponentially and at much greater magnitude than reported cases (red). (B) To reconcile these differences, we estimated a time-varying probability of detecting symptomatic infections, ρlocal, which yielded model predictions of reported cases (black and gray) consistent with daily reported cases (red). (C) An initial decline in ρlocal (black and gray) resulted from exponential growth of symptomatic infections (A) outpacing relatively constant testing (red) in early February. A later increase in ρlocal is consistent with a sharp increase in testing through late February and early March. (D) By 12 March, most symptomatic infections were still likely going undetected, despite increases in testing. Our analysis resulted in some estimates of ρlocal approaching one on 12 March, due to a portion of simulations with fewer symptomatic infections than reported cases that day. This was a consequence of the model being informed by data on cumulative deaths only and not reported cases. Black lines show the median, dark gray shading shows the interquartile range, and light gray shading shows the 95% PPI.
Fig. 3.
Fig. 3.
Daily incidence of deaths over time. Our model’s predictions under our baseline analysis were consistent with reported deaths through 12 March (dashed line) and indicate that many more deaths should have been expected after then based solely on infections that occurred by 12 March. This is due to the relatively prolonged delay between infection and death, as well as the model’s prediction that most infections that occurred through 12 March happened fairly close to then. Results to the right of the dashed line do not reflect additional deaths that would result from new infections occurring 13 March or after, which would be expected to add considerably to the number of deaths in April and May. The black line shows the median, dark gray shading shows the interquartile range, and light gray shading shows the 95% PPI.

References

    1. World Health Organization , Geneva, Switzerland. "Coronavirus disease 2019 (COVID-19) situation report" (Tech. Rep. 51, 2020).
    1. van Doremalen N., et al. , Aerosol and surface stability of HCoV-19 (SARS-CoV-2) compared to SARS-CoV-1. medRxiv:2020年03月09日.20033217 (13 March 2020).
    1. Tindale L. C. et al. ., Evidence for transmission of COVID-19 prior to symptom onset. eLife 9, e57149 (2020). - PMC - PubMed
    1. Bai Y. et al. ., Presumed asymptomatic carrier transmission of COVID-19. JAMA 323, 1406–1407 (2020). - PMC - PubMed
    1. Mizumoto K., Kagaya K., Zarebski A., Chowell G., Estimating the asymptomatic proportion of 2019 novel coronavirus onboard the Princess Cruises Ship, 2020. Euro Surveill 25, pii=2000180 (2020). - PMC - PubMed

Publication types

MeSH terms

Cite

AltStyle によって変換されたページ (->オリジナル) /